Tag Archives: Africa

Hunger Map 2012

mdg hunger map 2012One of the targets of the Millennium Development Goals (MDG) is to reduce the number of people with hunger by half by the year 2015. An estimated 870 million people still suffer from hunger around the world.

This map published by the Food and Agriculture Organization of the United Nations (FAO), shows that a good number of developing nations have made progress toward reaching that goal, as can be seen for the countries in green, with East Asia and Latin America as the top performers. On the other hand, many countries in Africa and West Asia have not made any progress, or worse, their situation has even deteriorated as can be seen for the countries in yellow or red.
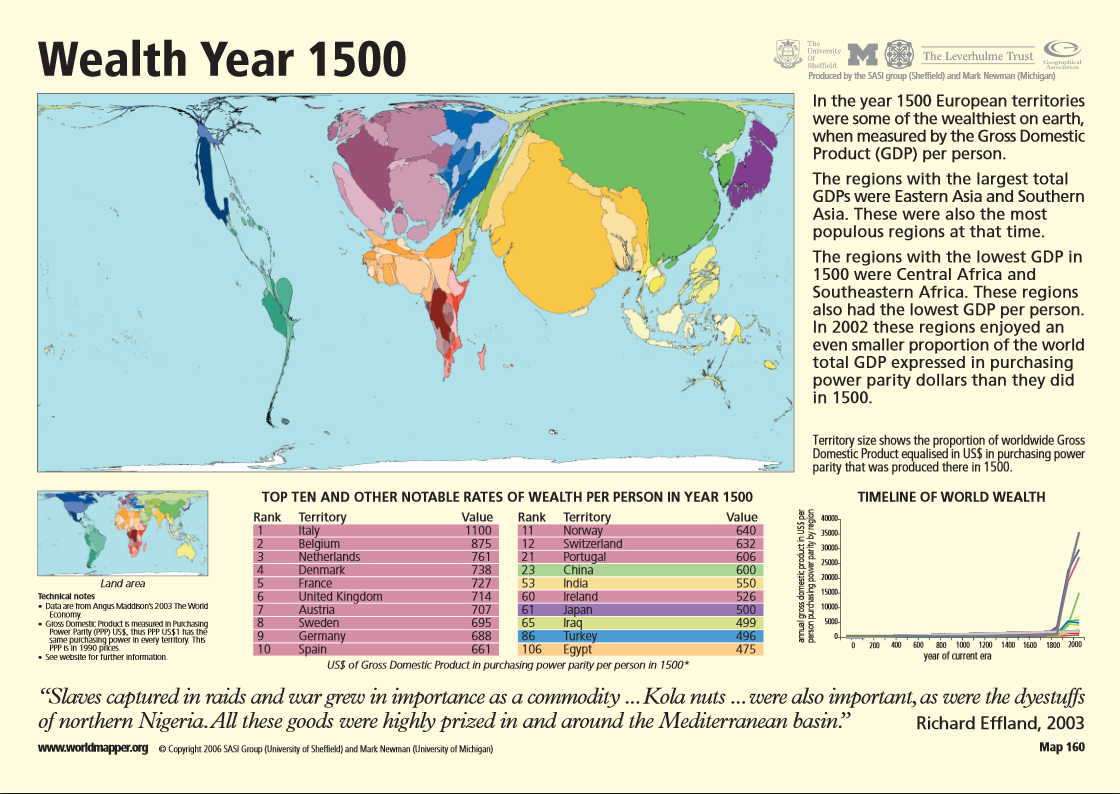


Wealth Comparison for the Years 1500 and 2015

wealth year 1500

wealth year 2015Comparing the levels of wealth per person for the years 1500 and 2015, as shown in these two maps, it is interesting to see how economic power has shifted from some nations to others.

Back in the 1500s, economic power was held by a majority of European nations leaded by Italy. China ranked number 23, India 53, and Japan 61. North America’s wealth was negligible compared to Europe’s, but the African region enjoyed more wealth than they do today.

A forecast for the year 2015 places Taiwan, Hong Kong, and Singapore at the top in GDP per capita. Some European nations are still wealthy, such is the case of Malta, Luxembourg, Norway, and Ireland, but Italy is not in the lead anymore. Japan’s wealth per capita has increased, and so has the United States’, but the wealth of African countries has become the lowest worldwide.

Source: Global Finance: Wealth Distribution and Income Inequality by Country


Drought Severity by Country (1901 – 2008)

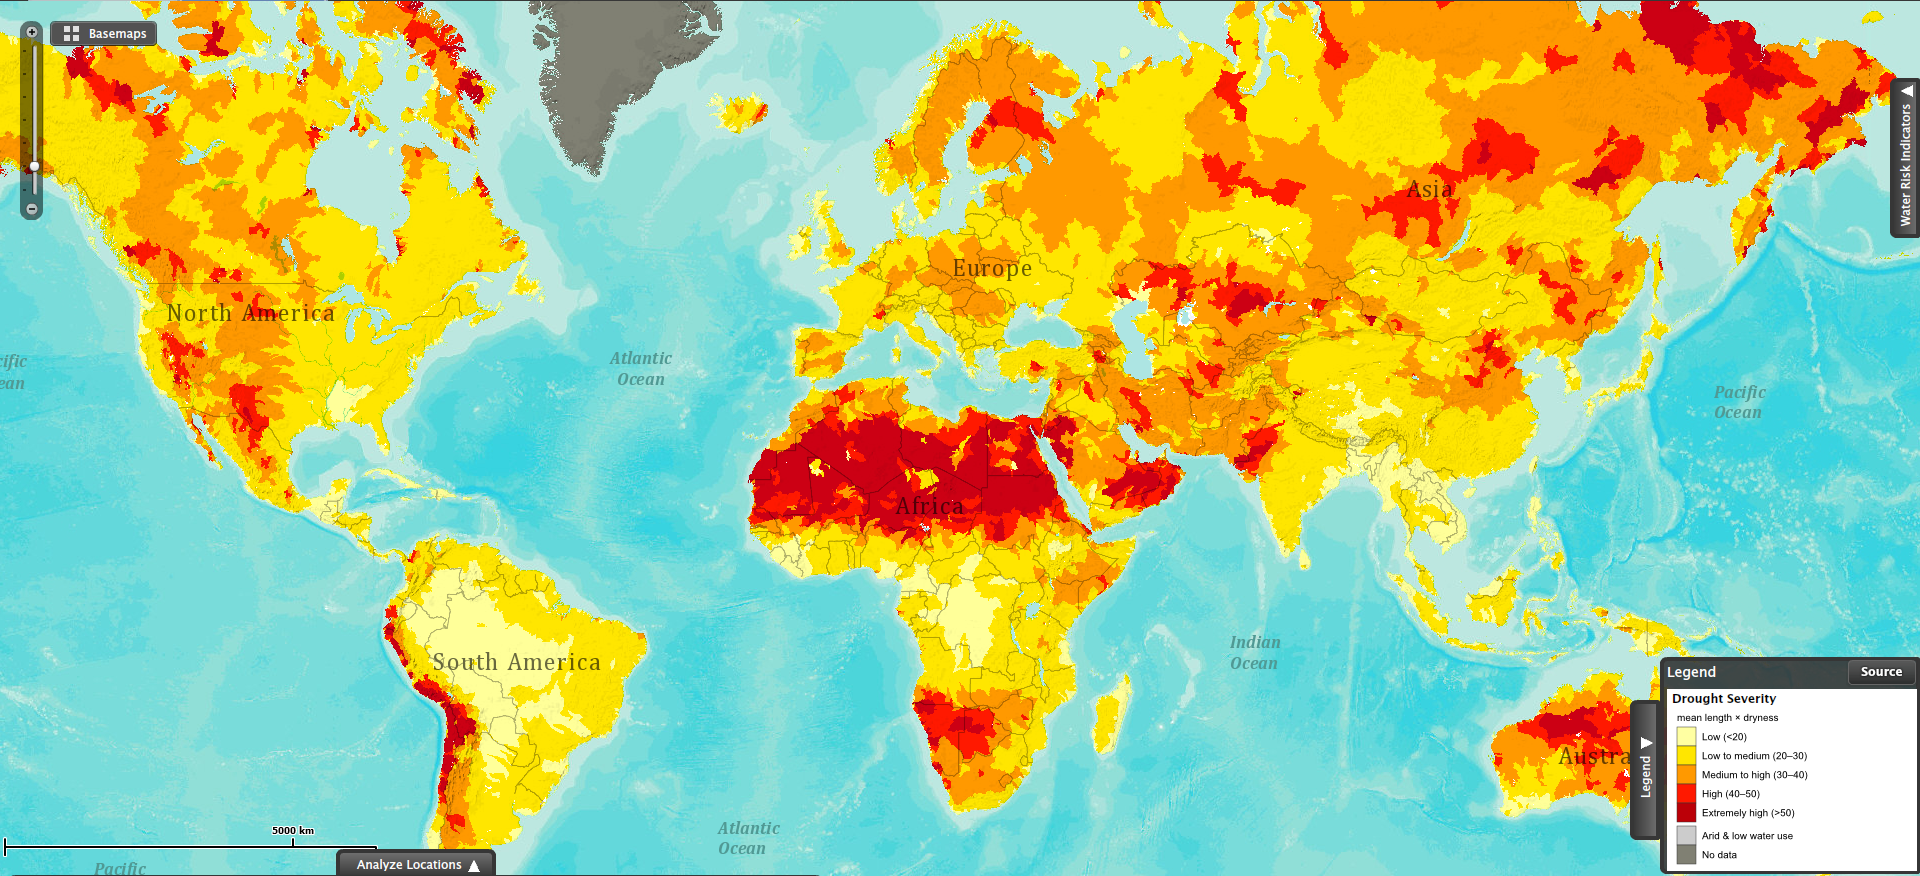
drought severity worldThis map shows drought severity, measured as the product of the average length of a drought occurrence and how dry it was the drought. This visualization is based on data collected for the period between 1901 and 2008.

The red areas in the map show the regions most severely affected by droughts. The northern region of the African continent stands out as the largest area being affected by severe droughts. Southwestern Africa (Namibia and Botswana) has also been severely affected by droughts in the same period.

Some areas in the Andean region in South America (Ecuador, Peru, Bolivia, Chile and Argentina) have also suffered the effects of severe droughts during the past century.

Parts of Australia and Russia have also been affected by extreme drought conditions.

Sources:


Human Development Index 2012

The Human Development Index (HDI) is a composite measure that includes three indicators: life expectancy at birth, level of education attained, and income. The HDI is an alternative to the purely economical GDP, that quantifies economic growth only. Thus, the HDI provide a way to gauge the development of a country. The HDI for 2012 includes 187 countries.

The HDI ranks countries according to their degree of development using a scale from 0 to1, 0 being the least developed and 1 being the most developed country.

In the HDI map above, published by the Brazilian media site Globo.com we find that Norway has a score of 0.955, ranking number one as the most developed country (color green). Norway is followed by Australia, the U.S., the Netherlands, Germany, New Zealand, among others.

At the other end of the spectrum we find the least developed nations (color purple), including the majority of African nations, Pakistan, Afghanistan, Myanmar, Bangladesh, Nepal, and Papua New Guinea.


Life Expectancy at Birth for Women

Life expectancy at birth, for women, varies significantly across the world.

On one side of the spectrum, we find nations where the life expectancy at birth for females is 80.5 years or more. Countries in this group include the United States, Canada, Chile, several developed nations in Northern, Southern and Eastern Europe, Australia, New Zealand, Japan, and South Korea.

On the other side, we find nations where the life expectancy at birth for females is much lower, 62.0 years or less. This group is comprised by the majority of African countries, with the exception of North African nations, and Afghanistan.

Resource: The World Bank DataBank: Gender Statistics – Life expectancy at birth, female (years)


The Origins and Age of Popes

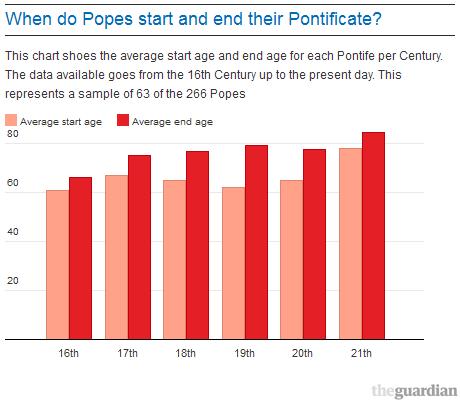
In the light of Pope Benedict XVI’s resignation last week, The Guardian created different visualizations related to the papacy. The reign of each Pontiff is usually due to death. The last one to resign was Gregory XII in 1415.

According to the graph shown above, 65 is the most common age at which Popes are elected, and 78 is the most common age at which they die. The Guardian used a sample of 63 Popes out of 266 to compute these numbers.

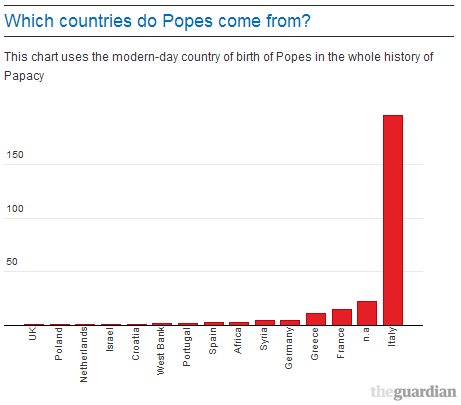
Of all 266 Popes, 196 came from Italy (74%). The origin cannot be traced for 22 Popes (8%). 15 Popes came from France (6%), 11 from Greece (4%), 5 from Germany, 5 from Syria, 3 from Africa, 3 from Spain, 2 from Portugal, and 2 from the West Bank. Countries from which only one Pope came from include: Croatia, Israel, Netherlands, Poland, and the UK.


Vulnerability to Climate Change

The Global Adaptation Institute (GAIN) created the GAIN Index to measure the vulnerability of countries to climate change, combined with how well prepared these countries are to face the global challenges associated with it.

Countries at extreme risk include North Korea, the Democratic Republic of Congo, Iraq, Burundi, Chad, Sudan and Zimbabwe. At the other end of the spectrum, countries with the lowest risk include Denmark, Australia, Switzerland, Norway, the UK, New Zealand, Norway, to name a few.

For a complete list of countries and index methodology visit: The Global Adaptation Institute: The GAIN Index


Malaria Around the World

click to enlarge

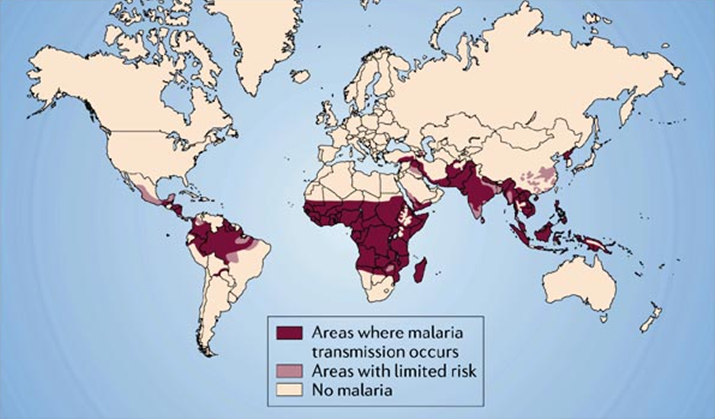
Malaria, a mosquito-borne infectious disease, affects 100 countries worldwide. It is mostly present in semi-tropical and tropical poor areas of Africa, South and Central America, and Asia. Of the 100 affected countries, 35 are located in Africa. Africa is the region most affected because its hot and humid weather makes transmission possible all year round. Lack of resources makes prevention and control of the disease very difficult. 89% of the malaria deaths worldwide occur in Africa.

Related Links:


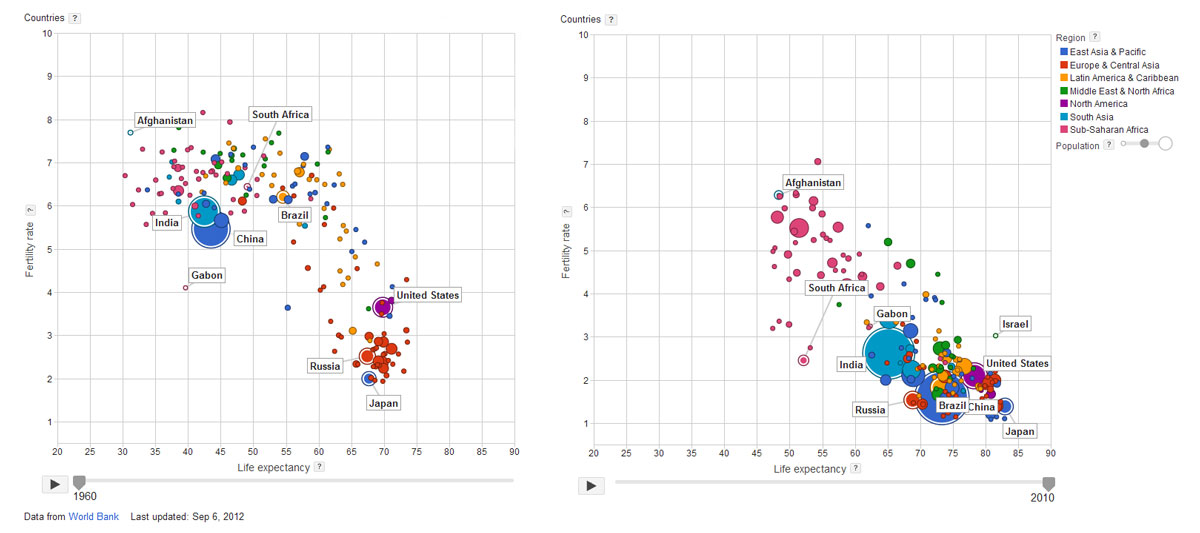
Life Expectancy vs. Fertility Rates Worldwide 1960-2010

click to enlarge

During the last fifty years, we have seen the gradual increase in life expectancy and the corresponding decrease in fertility rates worldwide. This is clearly the case of countries like China, India, the United States, Brazil, Japan, and Gabon, where dramatic improvements can be seen. On the other hand, countries like Russia, South Africa and Afghanistan, show moderate improvement.

It is very interesting to note, that although they have improved, a large cluster of African countries remain far from the overall trend, with lower life expectancy rates and higher fertility rates. For more information, check Google’s interactive bubble chart based on World Bank data.


Africa’s Resource Curse or Blessing

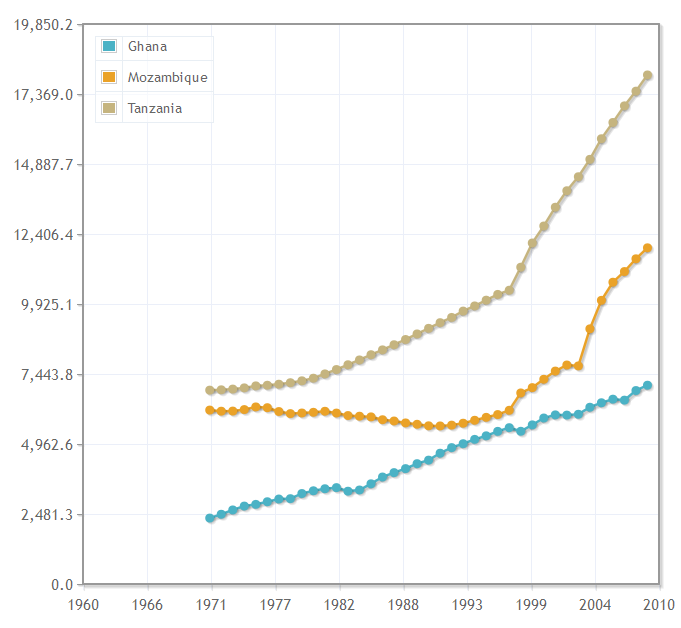
Energy Production for Select African Countries  (1960-2010)

The discovery of resources in developing countries has usually been more of a curse than a blessing for their economies, benefiting certain groups but not most of the population. Will this be the case for some African countries where resources have been recently discovered? Read more below:

  1. Energy Production of Select African Countries [IndexMundi]
  2. From Resource Curse to Blessing – Joseph Stiglitz [Project Syndicate]
  3. Beating the Resource Curse in Africa: A Global Effort – Terra Lawson-Remer and Joshua Greenstein [Council on Foreign Relations]
  4. Can New Oil States in Africa Avoid the ‘Resource Curse?’ Gabe Joselow [Voice of America News]
  5. Africa Must Tap Into Unused Resources – Kibaki – Wambui Ndonga [AllAfrica.com]
  6. Mining could spur Africa’s industrialization, but resource-curse risks persist – Terence Creamer [Engineering News]