Tag Archives: Pakistan

The Global Slavery Index 2013

global slavery index 2013

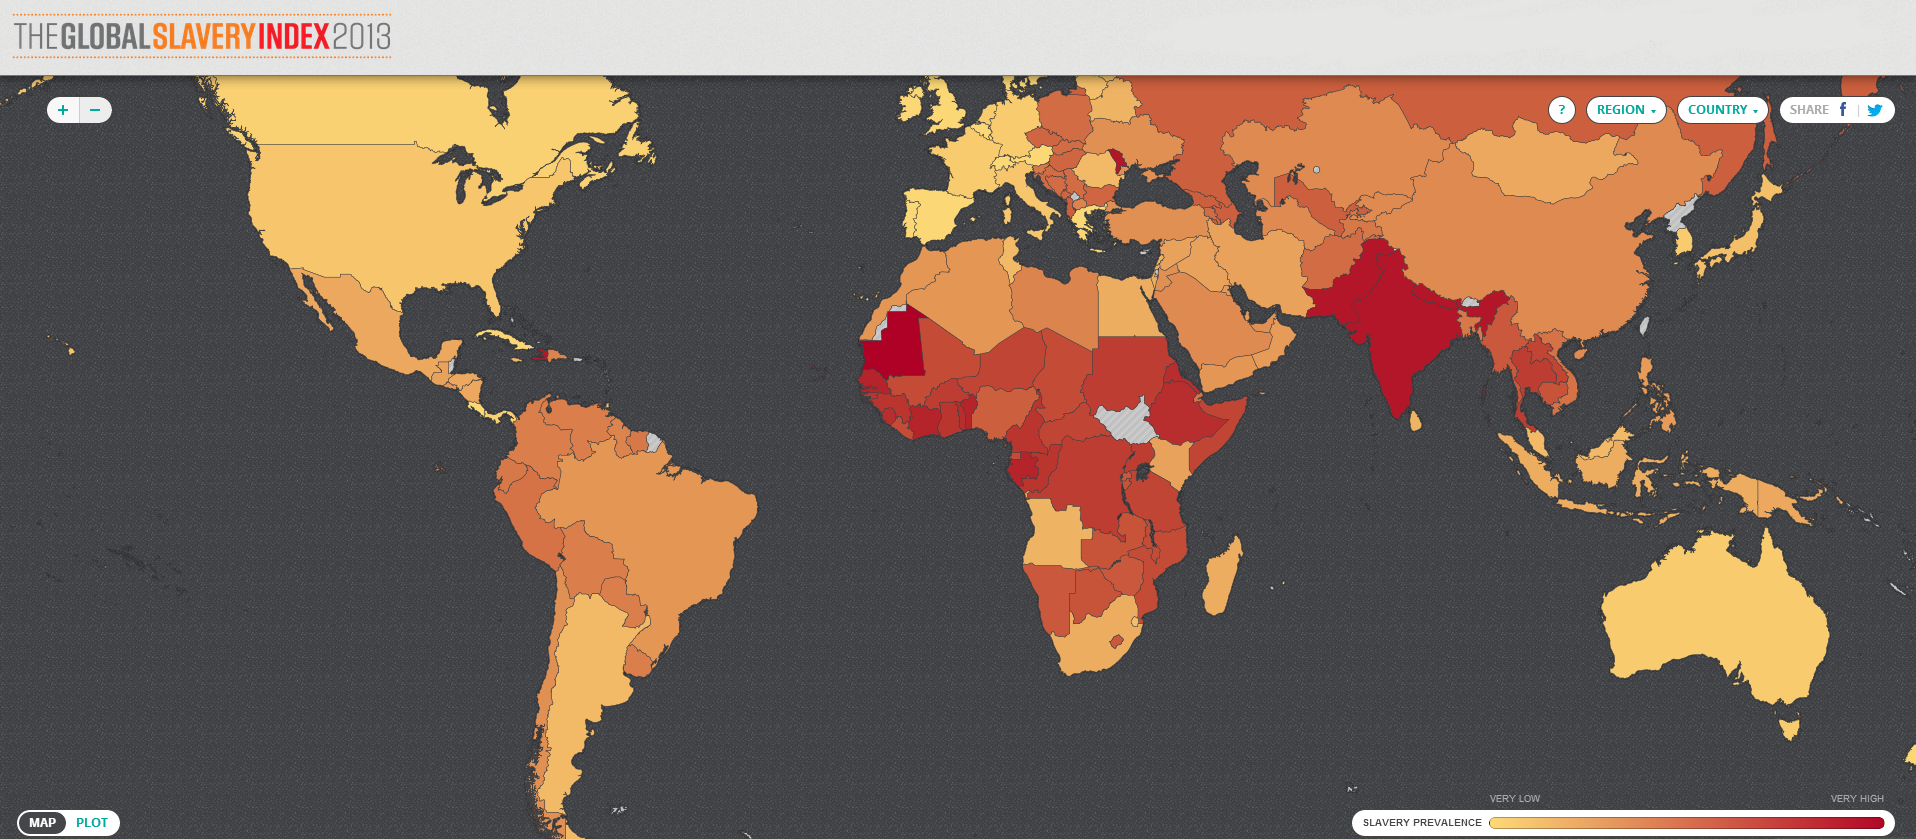
Slavery still exists in many parts of the world, whether it be in the form of forced labor, forced domestic servitude, sexual exploitation, debt bondage, bonded labor, or child marriage.

The Global Slavery Index provides insight into the number of people enslaved in 162 countries. The index takes into account three indicators: the prevalence of slavery per population, child marriage, and human trafficking.

India is a the top of the list with the largest absolute number of enslaved people, an estimated 14 million. China comes in second place with an estimated 2 million people enslaved. Pakistan is in third place with an estimated 2.1 million people in slavery. These countries are followed by Nigeria, Ethiopia, Russia, Thailand, Democratic Republic of Congo, Myanmar and Bangladesh. Put together, these countries account for 76% of the total enslaved people, or 29.8 million people, in the 162 countries that make up this ranking.

Source: Walk Free Foundation: The Global Slavery Index 2013


Freedom on the Net 2013

freedom on the net 2013

Freedom House has conducted a study on internet freedom in 60 countries across the globe.

What the authors of the study found is that global internet freedom has deteriorated in the last three years as a consequence of the increase of laws and regulations that try to limit free speech on the web.

An estimated 34 countries have seen a decline in internet freedom since 2012 including Vietnam, Ethiopia, Pakistan, and Venezuela. On the other hand, 16 countries have seen an improvement in internet freedom, among them Morocco, Burma, and Tunisia. Despite those improvements, limits on internet freedom are still rampant in many countries that make the list, where censorship, threats, and murder of bloggers and users who post information governments see as a threat continues.

Source: Freedom House: Freedom on the Net 2013


Refugees: Where Do They Come From?

refugees from where to where

As a consequence of armed conflicts happening in different parts of the world, inhabitants in those regions had been forced to flee and seek refuge in other countries.

As of 2011, the largest number of refugees was coming from Afghanistan (2.6 million people), followed by Iraq (1.4 million), and Somalia (1 million), as seen in the map above in color red. Countries where these refugees were seeking asylum included Pakistan, Iran, Syria, Kenya, Germany, and Jordan.

Up to the point when this data was collected, there was not an armed conflict going on in Syria. In fact, Syria was listed as an asylum destination for refugees coming from Iraq. That has changed now, and Syria has joined other countries torn by conflict whose inhabitants are seeking asylum in other parts of the world.

Source: Global Refugee Tracker: where are refugees from? And where do they go (2011)


Deaths from Organized Internal Conflict

deaths from organized internal conflictThe number of deaths as a result of internal armed conflicts has increased dramatically from 37,300 back in 2007 to 178,300 in 2012. Internal conflict is defined as armed conflict between two parties, one of which is the government of that country.

For 2012, the largest number of deaths have occurred in Syria (40.9%), Libya (17.3%), Mexico (14.2%), and Pakistan (5.2%). The areas of major conflict have switched from Iraq and Afghanistan back in 2007 to Syria and Libya in 2012.

Source: The Economist: Syria v Libya v Iraq – A numerical evaluation of recent conflict


The Quality of Democracy by Country

democracy ranking worldmap 2012Global Democracy Ranking released the Democracy Ranking for the year 2012, which shows the quality of democracy around the world.

Several indicators were used to calculate the Global Democracy Ranking. Those indicators were selected from a vast variety of dimensions such as politics, economy, environment, gender equality, education, health, and knowledge.

As seen in the map above, countries ranked at the top (dark green), those with the highest quality of democracy include Norway, Sweden, Finland, Switzerland, Denmark, Netherlands, New Zealand, Germany, Ireland, and Austria. In contrast, we find countries where democracy is at serious risk or where it is no longer a viable system (brown). Among these countries we have Yemen, Syria, Libya, Togo, Guinea-Bissau, China, Pakistan, Egypt, Nigeria, and Haiti.

Source: Global Democracy Ranking: Democracy Ranking 2012


Percentage of the Population Living on $2 or Less a Day

surviving on a few dollars per day worldMIT economists Abhijit V. Banerjee and Esther Duflo, conducted surveys in developing nations to see which countries survive on a few dollars per day. The cities or countries where people are known to live on meager dollar amounts on a daily bases are not that surprising, but the percentage of the population living under these conditions is.

In Udaipur and Hyderabad (India) a staggering 94% of the population survive on $2 or less per day. In Bangladesh, 69.4% go on $2 or less per day. In Ghana, 67.7% survive on $2 or less per day. In Guatemala, 64.8% of the population survive on $2 or less per day.

Source: GOOD: Living on Less


Number of Nuclear Tests Since 1945

North Korea conducted its third nuclear test on February, 2013. Two nuclear test preceded this one, the first in 2006, and the second in 2009.

However, the nation that has performed the largest number of nuclear tests since 1945 is the United States, a total of 1,032. In the same period, the USSR/Russia performed a total of 715 nuclear tests, and France performed a total of 210 nuclear tests.

Source: Statista: North Korea Conducts Third Nuclear Test


Human Development Index 2012

The Human Development Index (HDI) is a composite measure that includes three indicators: life expectancy at birth, level of education attained, and income. The HDI is an alternative to the purely economical GDP, that quantifies economic growth only. Thus, the HDI provide a way to gauge the development of a country. The HDI for 2012 includes 187 countries.

The HDI ranks countries according to their degree of development using a scale from 0 to1, 0 being the least developed and 1 being the most developed country.

In the HDI map above, published by the Brazilian media site Globo.com we find that Norway has a score of 0.955, ranking number one as the most developed country (color green). Norway is followed by Australia, the U.S., the Netherlands, Germany, New Zealand, among others.

At the other end of the spectrum we find the least developed nations (color purple), including the majority of African nations, Pakistan, Afghanistan, Myanmar, Bangladesh, Nepal, and Papua New Guinea.


Drone Attacks Visualized

click to enlarge

The use of drones to eliminate enemy targets has become routine practice for U.S. military operations since 2004, specially in Afghanistan and Pakistan.

Pitch Interactive has created the visualization above, showing the number of drone attacks since 2004 to date, as well as the number of casualties. Of an estimated 3,105 casualties, 175 were children (5.6%), 535 were civilians (17.2%), and 2,348 (75.6%) were casualties classified as other, which can include male able-bodied enemy combatants, their neighbors, and possible militants.

Data for this visualization was obtained by Pitch Interactive from the Bureau of Investigative Journalism,  the New America Foundation, and Living Under Drones.


Expected Years of Schooling for Females Worldwide

The expected years of schooling for females varies from country to country.

Developed nations such as the United States, Canada, the UK, France, Germany, Norway, Iceland, Australia, New Zealand, etc., show the highest number of expected years of schooling (15 to 21 years) for girls. Other nations in this group include Argentina, Uruguay, Kazakhstan, Libya, and South Korea.

On the other hand, countries with the lowest number of expected years of schooling (0 to 8 years) for females include most African countries, Pakistan, Afghanistan, Iraq, Yemen, Myanmar, Bangladesh, and Papua New Guinea.

Resource: The World Bank DataBank: Gender Statistics – Expected years of schooling for females