Tag Archives: Brazil

Things Each Country Leads the World In

what each country leads the world in

Each country leads the world in different things, from good to bad things to awkward ones.

According to the map above, France leads the world in tourism, India in making movies, Saudi Arabia in oil reserves, the United States in producing Nobel laureates, Greece in olive oil consumption, Switzerland in the rate of employment, Norway in democracy, Brazil in FIFA world cup titles, and Costa Rica in happiness, to name a few.

Other countries lead in not so positive things. For example, Russia leads in the number of nuclear warheads, China in carbon emissions, Afghanistan in opium production, North Korea in censorship, and Yemen in gender inequality.

Among the awkward we find Venezuela leading in the number of miss universe titles, Argentina in exporting soccer players, Netherlands in the tallest people, Iran in the highest brain drain, Sweden in atheism, and Mexico in lightning strikes.

Source: Policy Mic: This Map Shows the Weird Things Each Country Leads the World In


Oil Production and Consumption by Country

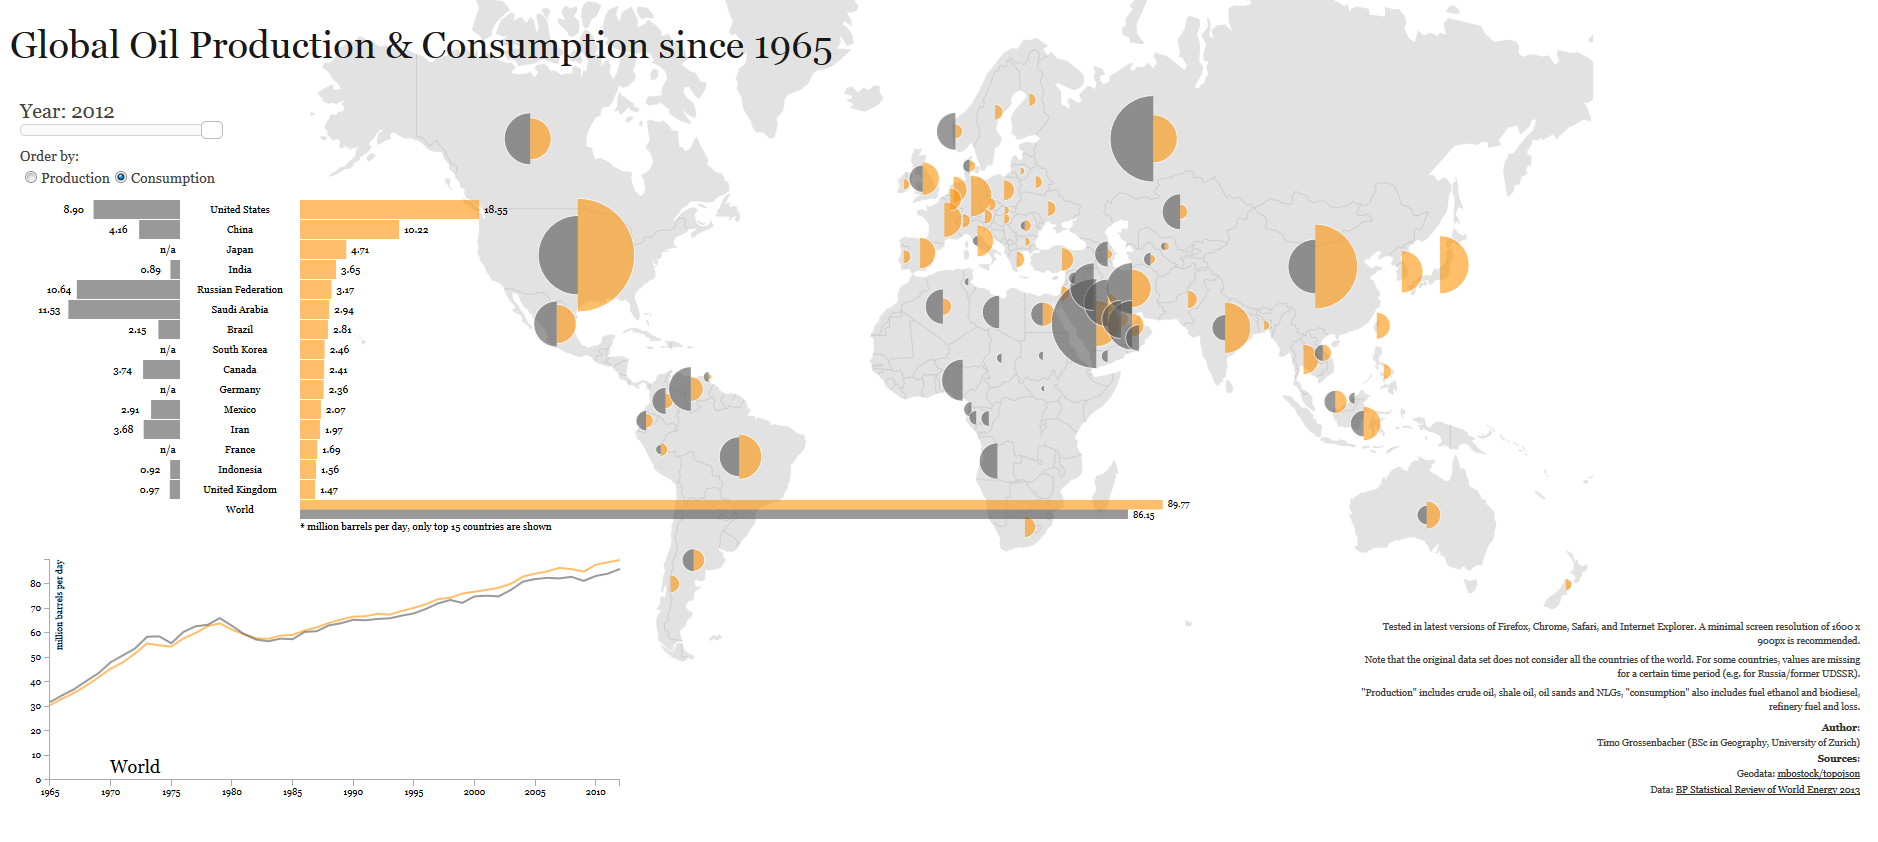
oil production and consumption since 1965When it comes to oil production and consumption, countries have a very close relationship of interdependence with each other. Some countries consume more oil than what they produce relying on imports to satisfy their internal demand. Others, consume less than what they produce, being able to export oil to nations that need it.

Oil consumption (yellow) for the United States, for example, was larger than its production (grey) for 2012, 18.55 mb/d (million barrels per day) compared to 8.9 mb/d, importing more than double its production to satisfy the gap in internal demand. Other nations with oil consumption higher that oil production include China, Brazil, Australia, India, UK, and Indonesia.

In contrast, oil consumption for Saudi Arabia for 2012 is estimated at 2.94 mb/d, while its production reached 11.53 md/d, exporting its oil surplus to the rest of the world. Other nations whose oil production exceeds its oil consumption include Canada, Mexico, Venezuela, Norway, Russia, Kuwait, United Arab Emirates, and Qatar.

Source: Winston Smith Labs: Global Oil Production and Consumption since 1965 [Interactive Map/Graph]


Basic Salary of Lawmakers by Country

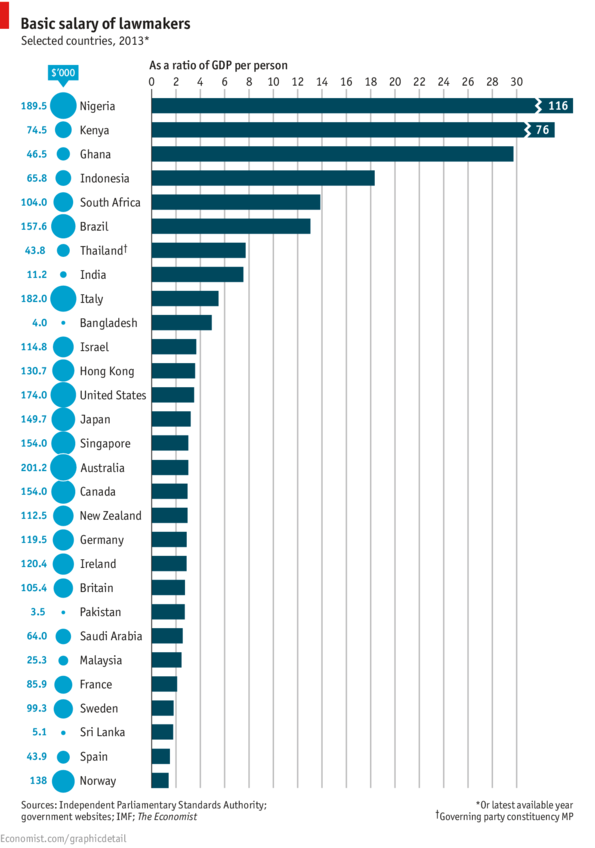
basic salary of lawmakers by country 2013How much lawmakers are paid is a sensitive issue especially in times of economic austerity, or in countries where the majority of the population lives in extreme poverty conditions.

In this chart prepared by The Economist, we can see how much lawmakers are being paid in different countries across the globe in U.S. dollars (left), and as a ratio of the gross domestic product (GDP) per capita (right).

In Nigeria, for example, lawmakers receive a basic salary of $189,000, 116 times the country’s GDP per capita. In Kenya a lawmaker makes a basic salary of $74,500, 76 times the country’s GDP per capita. Other countries were lawmakers receive the heftiest salaries include Ghana, Indonesia, South Africa, Brazil, Thailand, and India. It is worth pointing out that most of these countries are some of the poorest in the world.

In comparison, in the wealthiest nations a lawmaker’s salary as a ratio of GDP is much smaller. In Britain, that ratio is 2.7 of the GDP per capita.


Gay Marriage by Country

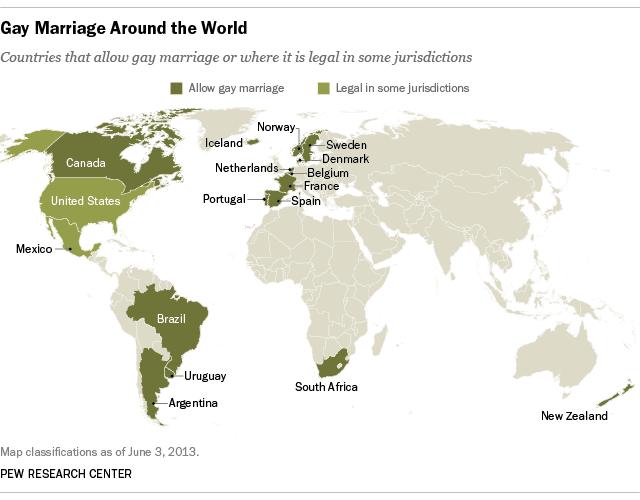
gay marriage around the worldTo date, 15 countries allow gay marriage: Canada, Brazil, Argentina, Uruguay, Norway, Sweden, Denmark, Iceland, Netherlands, Belgium, France, Spain, Portugal, South Africa, and New Zealand.

Same-sex marriage is legal in some jurisdictions of Mexico and the United States. Currently, 12 states in the U.S. permit same-sex marriage, while 30 states have amended their constitutions to ban it.

Resource: Pew Research Center: A global snapshot of same-sex marriage


World Production of Rare Earth Metals

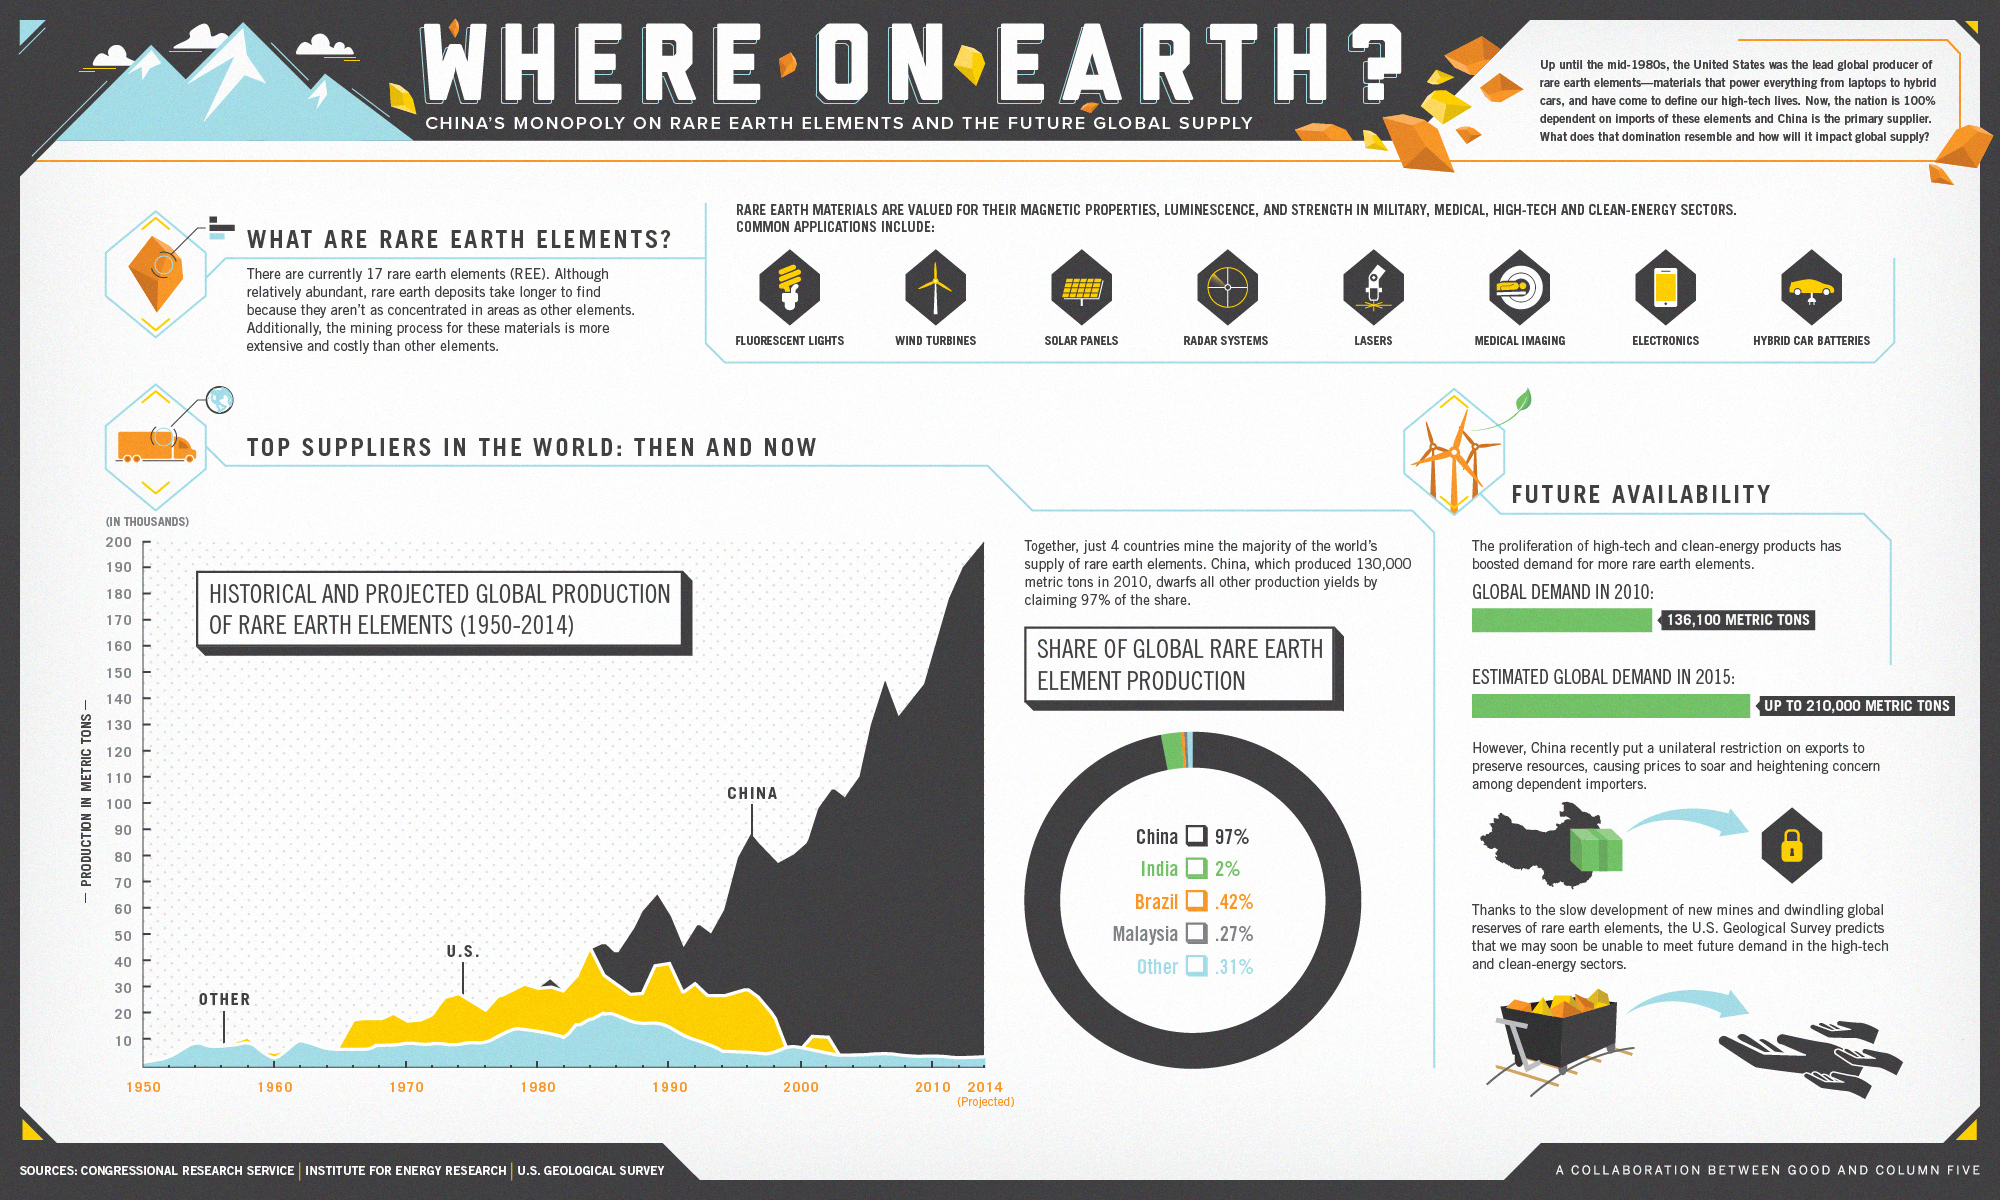
the future global supply of rare earth elementsRare earth metals or rare earth elements are a collection of seventeen chemical elements located at the bottom of the periodic table. They are key elements in the manufacture of high technology components, hybrid cars, solar panels, lasers, electronics, etc.

As of 2010, China produced 97% of the total world production of rare earths, or 130,000 metric tons, followed by India (2%), Brazil (0.42%), and Malaysia (0.27%).

The estimated demand for rare earths for 2015 will increase 54% compared to the demand in 2010.

Source: GOOD: Infographic: The Future Global Supply of Rare Earth Elements

See also: IndexMundi: Commodities Glossary – Rare Earth Metals


Key Commodities and Emerging Markets

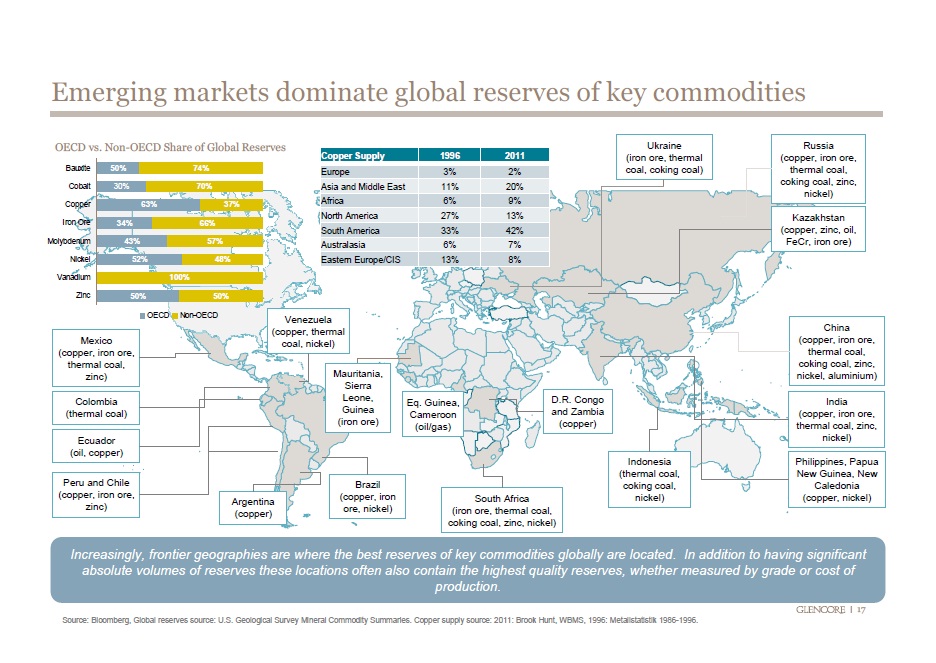
emerging market dominate commoditiesCommodities are raw materials essential for the production of more complex products. Commodities fall into three large categories: agricultural, energy, and metals.

According to this visualization, emerging economies (Brazil, Russia, India Indonesia, China, South Africa, etc.) have the largest reserves of certain key energy and metal commodities such as oil, coal, copper, cobalt, iron ore, molybdenum, nickel, zinc, and aluminum.

Source: Business Insider: 36 Maps That Explain The Entire World


Percentage of the Population Living on $2 or Less a Day

surviving on a few dollars per day worldMIT economists Abhijit V. Banerjee and Esther Duflo, conducted surveys in developing nations to see which countries survive on a few dollars per day. The cities or countries where people are known to live on meager dollar amounts on a daily bases are not that surprising, but the percentage of the population living under these conditions is.

In Udaipur and Hyderabad (India) a staggering 94% of the population survive on $2 or less per day. In Bangladesh, 69.4% go on $2 or less per day. In Ghana, 67.7% survive on $2 or less per day. In Guatemala, 64.8% of the population survive on $2 or less per day.

Source: GOOD: Living on Less


Billionaires and their Wealth by Country

This map of the world’s wealthiest citizens was created by Forbes. A total of 1,426 billionaires were found across the globe, worth $5.4 trillion combined.

The wealth of billionaires in the U.S. alone, 1,872.5 trillion, is larger than the combined wealth of billionaires in each continent. The wealth of the world’s richest in the Americas is an outstanding $2.4 trillion thanks to the contributions of billionaires mainly from the U.S., Brazil, Mexico, Canada, Chile, Colombia, Peru, and Venezuela.

The Americas are followed by Europe, where the wealth of its billionaires combined is valued at $1.55 trillion. Europe is followed by Asia with the wealth of its billionaires estimated at $1.16 trillion. Africa and the Middle East come at last, where the total net worth of its richest citizens is valued at $279 billion.


Food Exports and Imports Worldwide

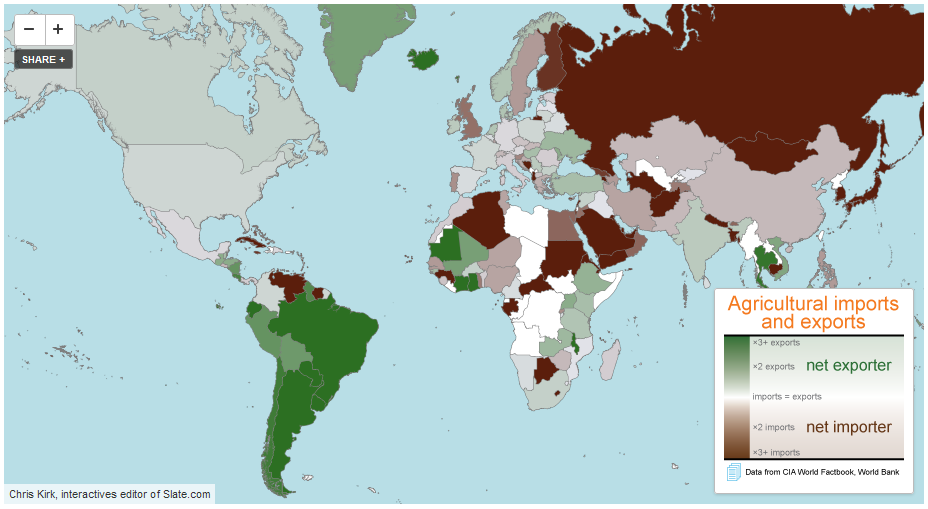
Some countries are net exporters of food (their food exports are larger than their food imports) while others are net importers of food (their food imports are larger than their food exports).

Among the net exporters of food we find the majority of South American countries, with the exception of Venezuela and Suriname, the United States, Canada, Mauritania, Indonesia, Australia, and a few African countries such as Mauritania, Ivory Coast and Ghana. The largest net exporter of food, by far, is Argentina with $23.42 of food exports per every $1.00 of food imports. Argentina is followed by Brazil, New Zealand, Paraguay and Iceland.

Among the net importers of food we find countries such as Russia, Finland, Sweden, the UK, Italy, Germany, Portugal, Sudan, Cuba, Saudi Arabia, Japan, etc. The largest net food importer is Eritrea, with $0.01 of food exports per every $1.00 of food imports. Eritrea is closely followed by Venezuela, Turkmenistan, and Algeria.

Data for for both agricultural exports and imports are for 2010.

Source: Slate.com: Maps: Agriculture in the U.S. and Around the World


Sweet Deal: The Global Trade of Chocolate

click to enlarge

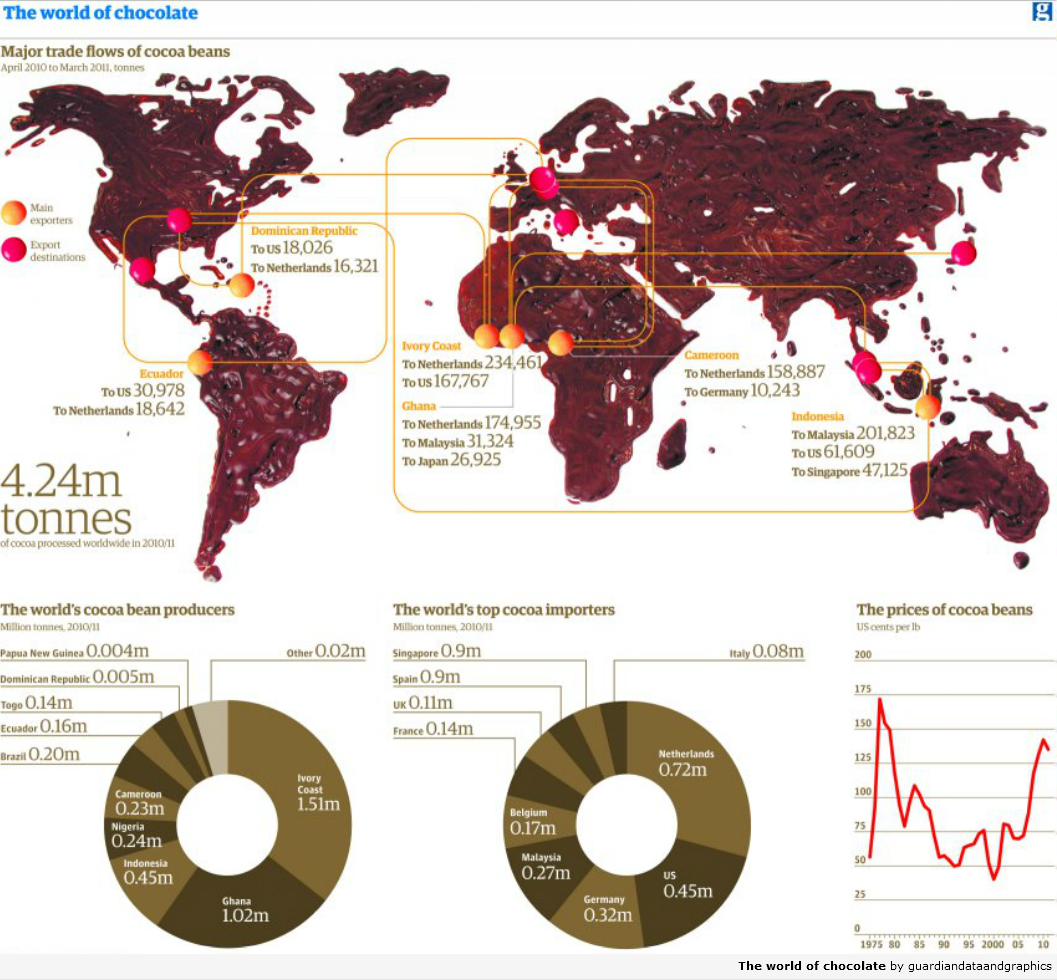
This visualization by The Guardian, actually made out of real chocolate, depicts the world trade (exports and imports) of chocolate. Between 2010 and 2011, 4.24 million tons of cocoa beans were processed worldwide.

The top cocoa bean producers are: Ivory Coast, Ghana, Indonesia, Nigeria, Cameroon, Brazil, and Ecuador, among others. The top importers include: Netherlands, the United States, Germany, Malaysia, Belgium, France, the UK, and Spain.

For a list of the top global confectionery companies, visit: International Cocoa Organization: The Chocolate Industry