We just released a new tool for those of you who need to quickly find where a county is located on a map of the US. Try it at https://www.indexmundi.com/county-finder/
We just released a new tool for those of you who need to quickly find where a county is located on a map of the US. Try it at https://www.indexmundi.com/county-finder/
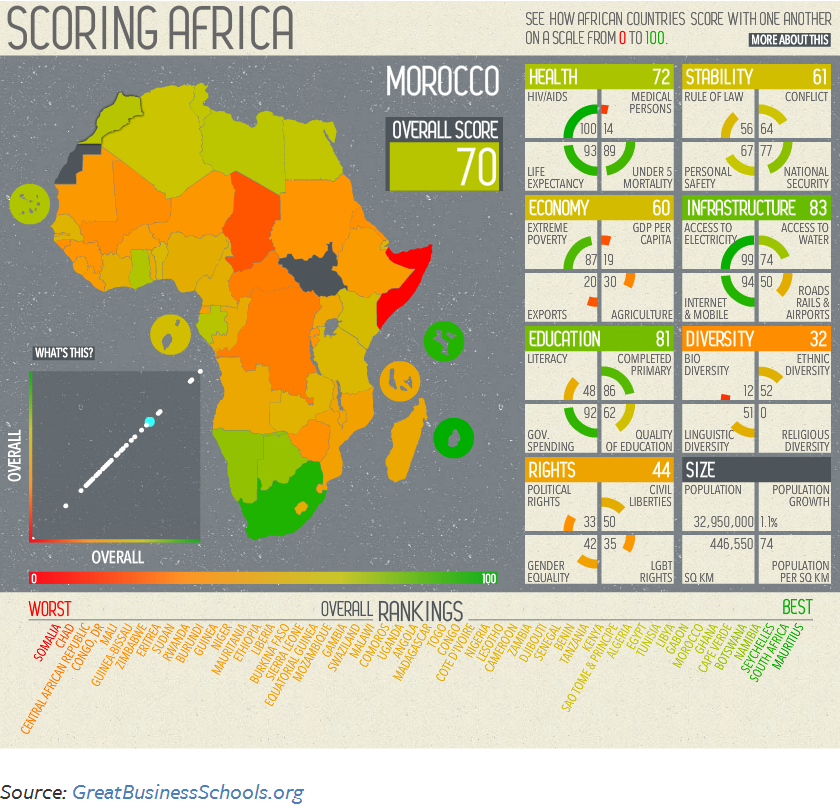
The African continent is home to 54 countries ranging from prosperous ones to countries that are plagued by violence and extreme poverty.
The chart above shows how African countries compare with one another, taking into account different indicators such as human rights, education, the state of the economy, political stability, the diversity and size of its population, and access to healthcare.
Countries with the highest score (best) include Mauritius, South Africa, and Seychelles. Countries with the lowest score (worst) include Somalia and Chad. In between these two extremes there are a wide range of countries performing well in some areas, and not so well in others.
Source: PolicyMic: This Awesome Interactive Map Will Make You Think Twice About Africa
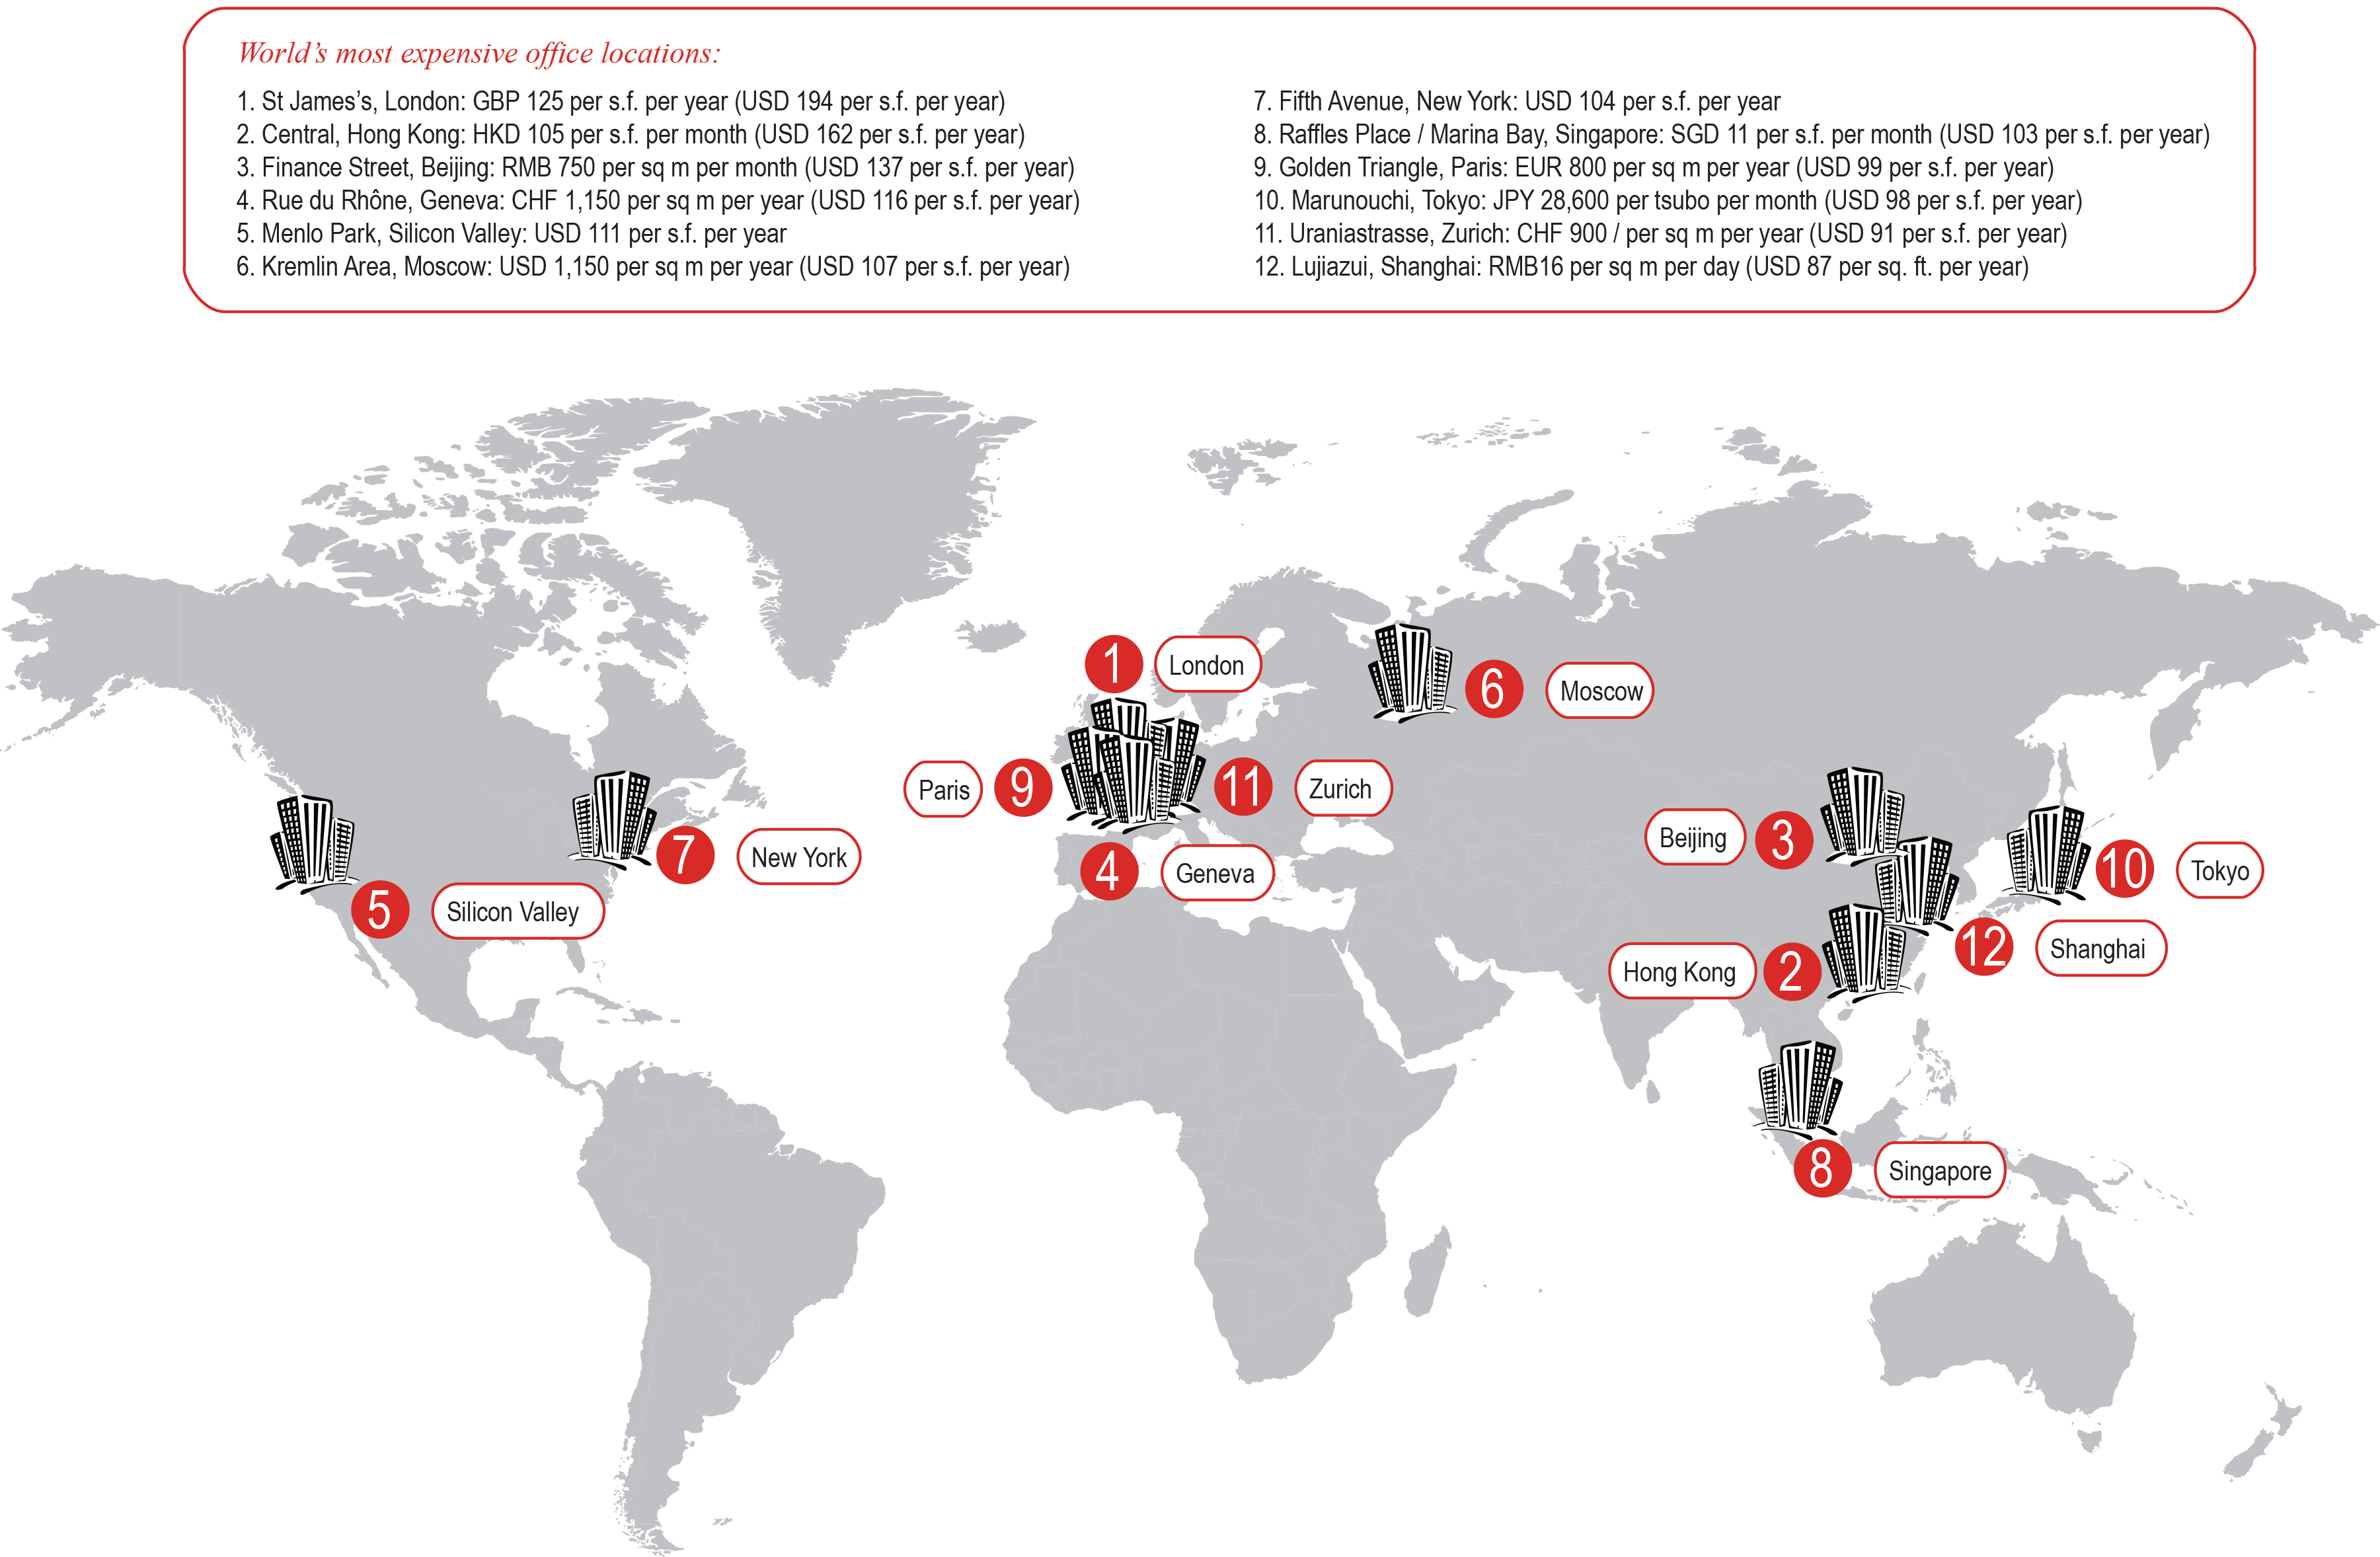
Expensive office locations around the world share similar characteristics: they are located in premier trade and financial centers, they are sites for corporate headquarters, they are located in areas where property availability is scarce and therefore expensive, and they are located close to their most wealthy customers.
As we can see in the map above, the most expensive office spaces are located in Europe, Asia and the United States. London’s St. James area leads as the most expensive location for office space. London is followed by Hong Kong’s Central area, Beijing’s Finance Street, Geneva’s Rue du Rhône, and Silicon Valley’s Menlo Park.
Source: LinkedIn: Paying the Rent: The World’s 12 Most Expensive Office Locations

Each country leads the world in different things, from good to bad things to awkward ones.
According to the map above, France leads the world in tourism, India in making movies, Saudi Arabia in oil reserves, the United States in producing Nobel laureates, Greece in olive oil consumption, Switzerland in the rate of employment, Norway in democracy, Brazil in FIFA world cup titles, and Costa Rica in happiness, to name a few.
Other countries lead in not so positive things. For example, Russia leads in the number of nuclear warheads, China in carbon emissions, Afghanistan in opium production, North Korea in censorship, and Yemen in gender inequality.
Among the awkward we find Venezuela leading in the number of miss universe titles, Argentina in exporting soccer players, Netherlands in the tallest people, Iran in the highest brain drain, Sweden in atheism, and Mexico in lightning strikes.
Source: Policy Mic: This Map Shows the Weird Things Each Country Leads the World In
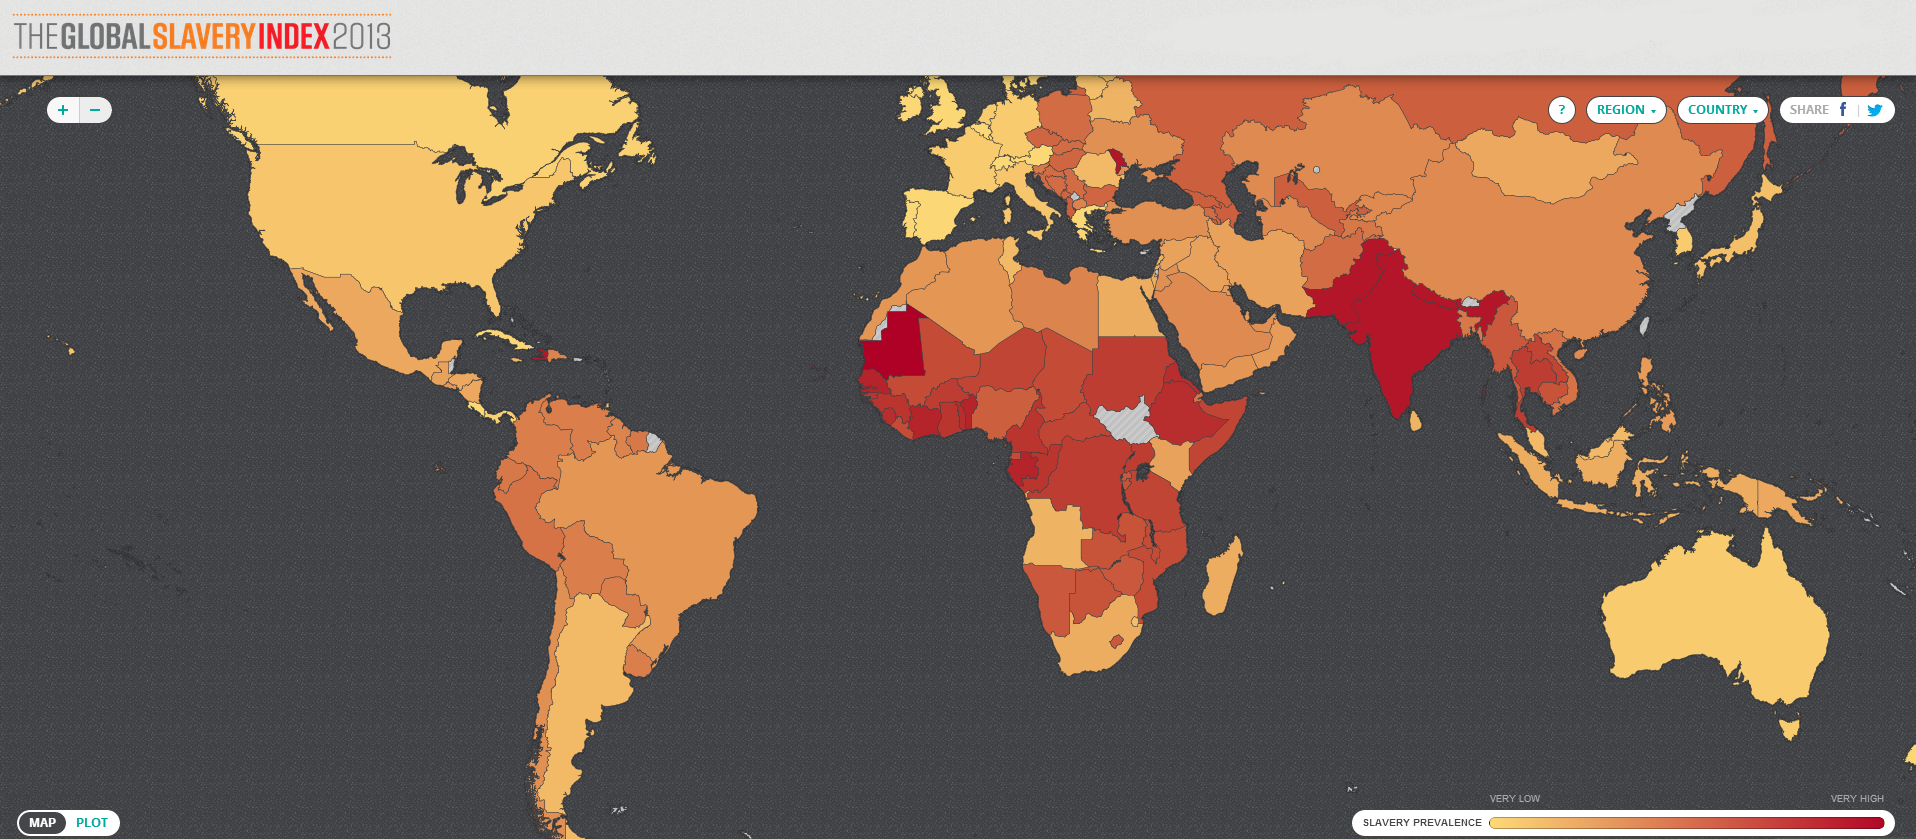
Slavery still exists in many parts of the world, whether it be in the form of forced labor, forced domestic servitude, sexual exploitation, debt bondage, bonded labor, or child marriage.
The Global Slavery Index provides insight into the number of people enslaved in 162 countries. The index takes into account three indicators: the prevalence of slavery per population, child marriage, and human trafficking.
India is a the top of the list with the largest absolute number of enslaved people, an estimated 14 million. China comes in second place with an estimated 2 million people enslaved. Pakistan is in third place with an estimated 2.1 million people in slavery. These countries are followed by Nigeria, Ethiopia, Russia, Thailand, Democratic Republic of Congo, Myanmar and Bangladesh. Put together, these countries account for 76% of the total enslaved people, or 29.8 million people, in the 162 countries that make up this ranking.
Source: Walk Free Foundation: The Global Slavery Index 2013
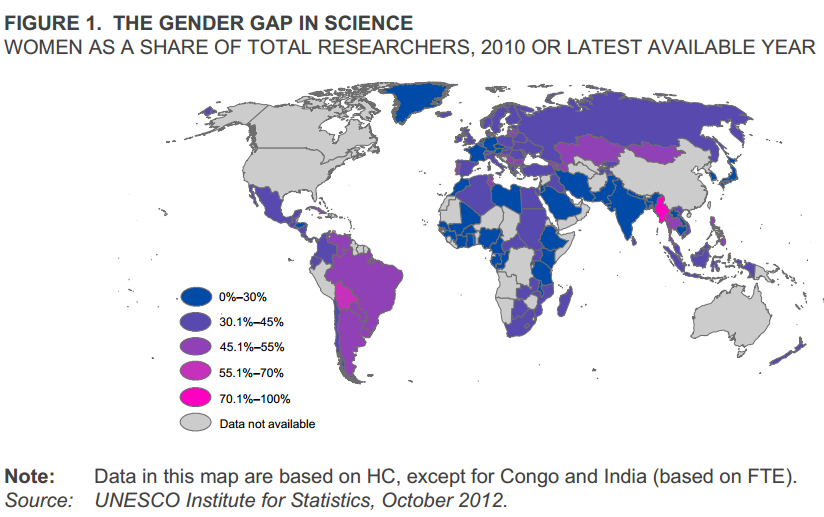
The number of women researchers is small compared to that of men globally. Researchers are professionals who are engaged in the creation of new knowledge, technologies, or products.
The map above shows the number of women as a share of total researchers by country. It is interesting to note that countries like Bolivia and Burma, both developing nations, show the highest ratio of female researchers compared to the total in each country. Since the data used here is based on headcounts of people employed in R&D full time and part time, I would take this results with caution considering that the total number of researches in these countries could be very low to begin with, and the results, therefore, not very solid.
In the same manner, the percentage of women researchers for Latin America and the Caribbean as a share of the total is the highest in the world, higher than the number for developed nations (45.2% according to this study) which seems counter-intuitive.
Source: UNESCO Institute of Statistics: Women in Science – The Gender Gap in Science
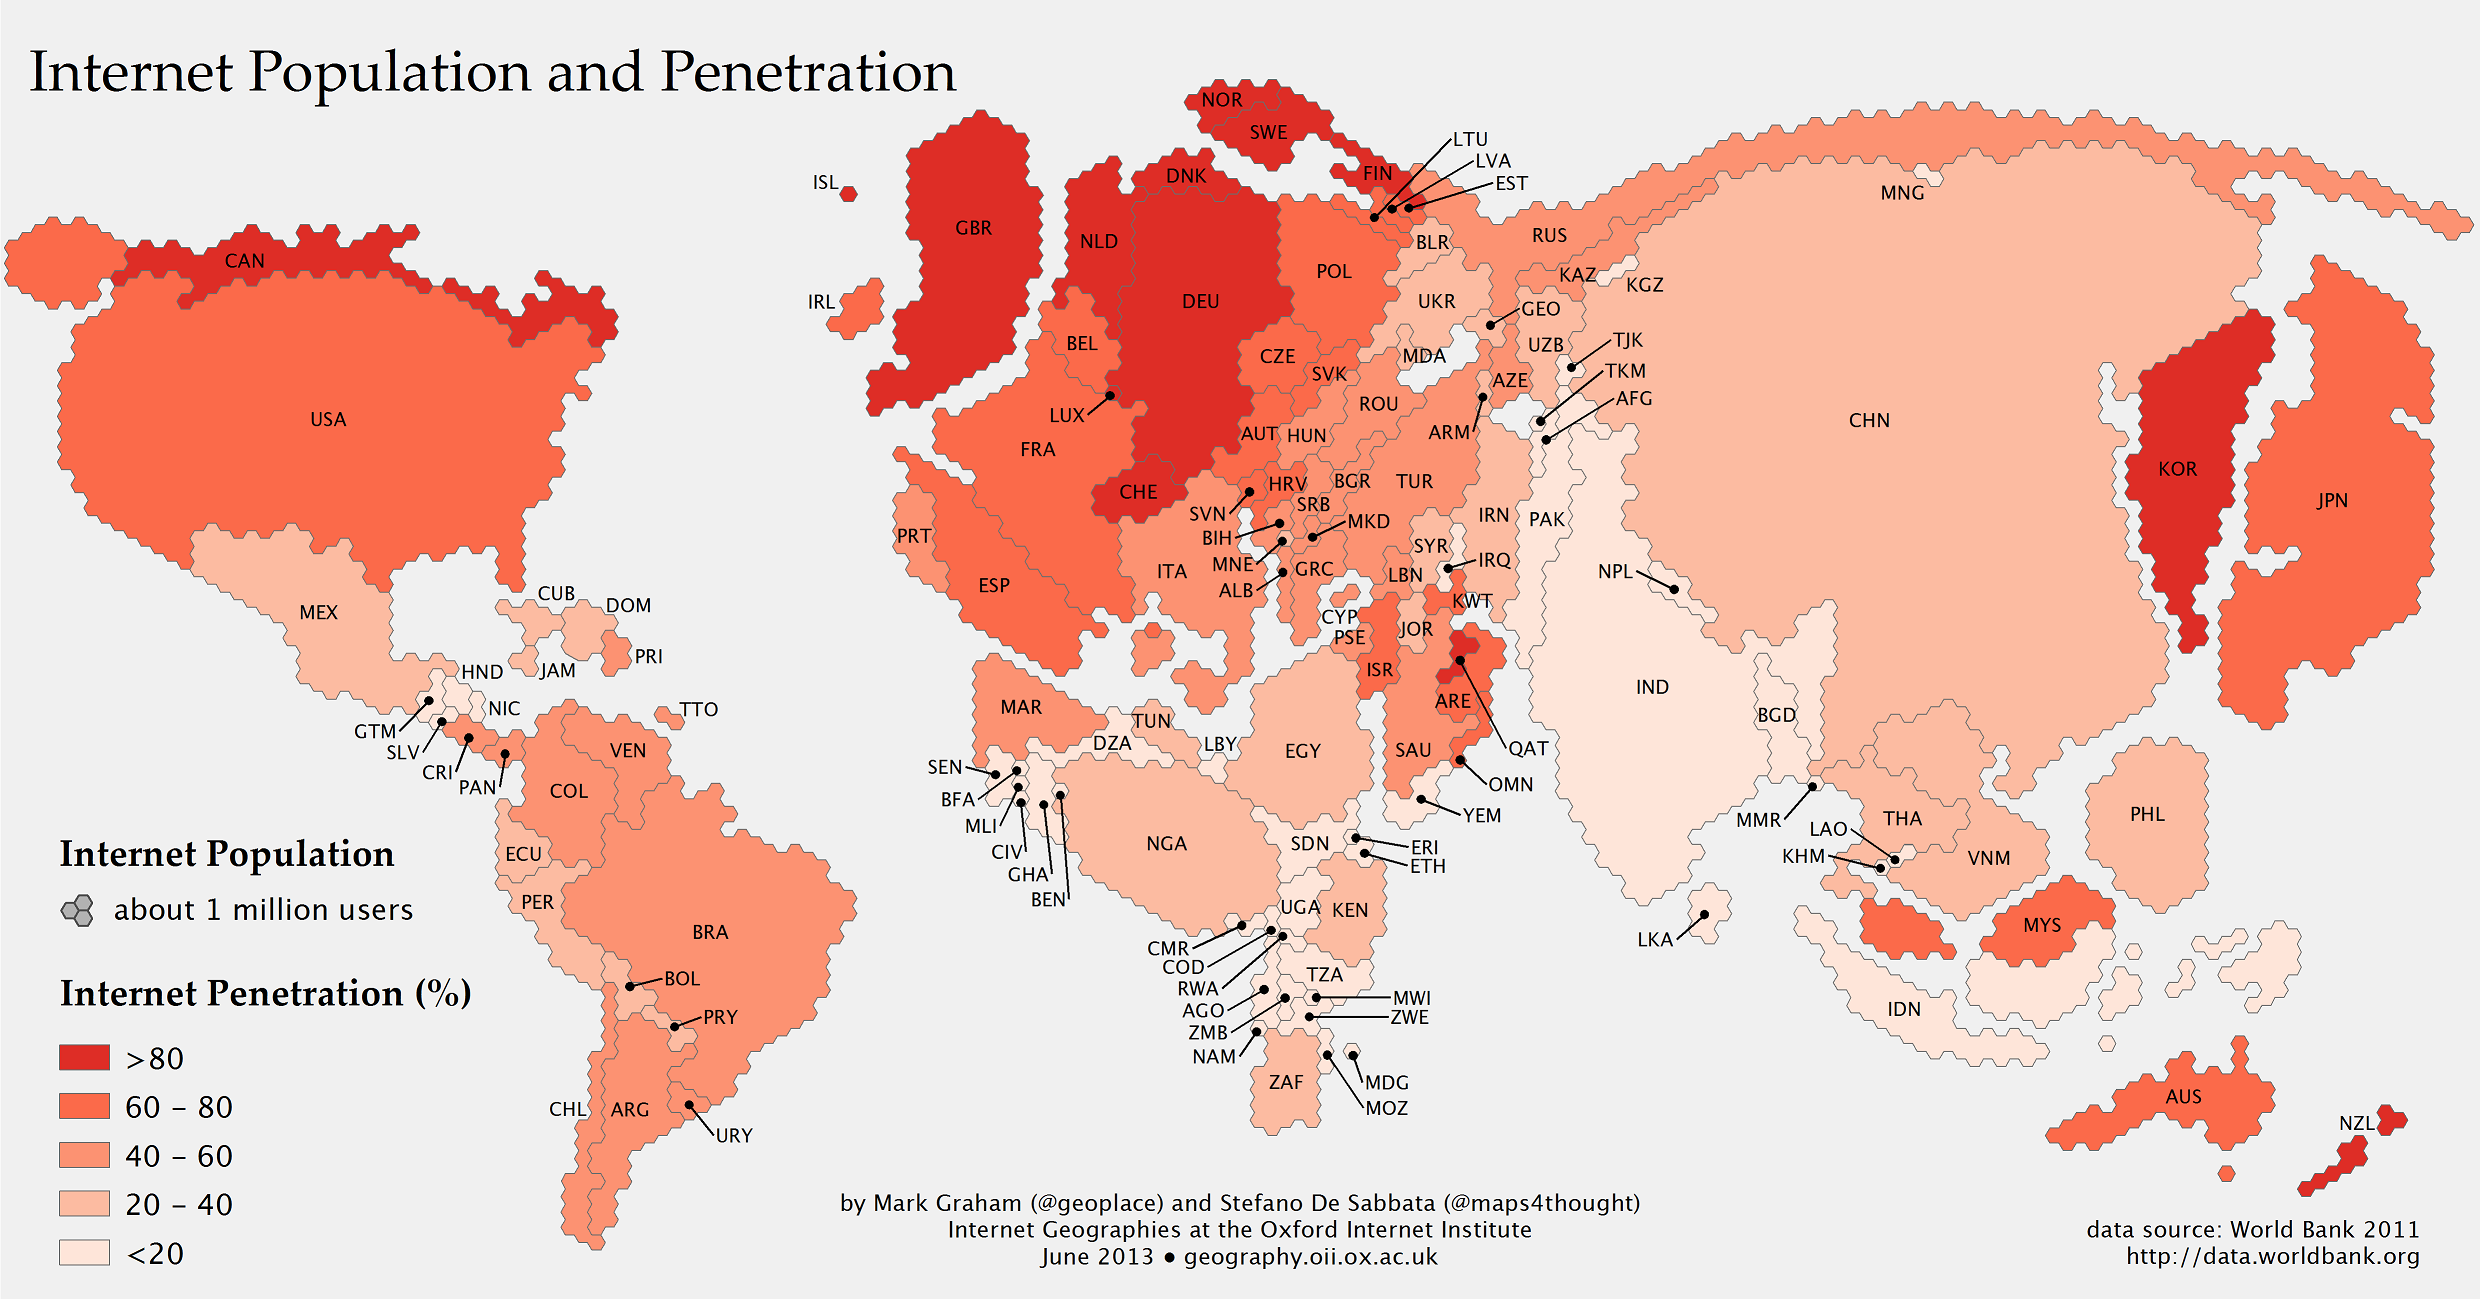
An estimated one third of the world population is connected to the internet while the remaining two thirds do not have have access to it yet, according to the website Information Geographies.
As shown in the map above, the distortion in the size of China points out the fact that it is the country with the largest number of internet users, roughly 500 million people. China is followed by the United States, India, and Japan, among others.
Countries with the largest internet penetration, the percentage of the population of each country connected to the internet, include Canada, Great Britain, Netherlands, Denmark, Norway, Sweden, South Korea, Germany, Finland, Qatar, and New Zealand.
Source: Information Geographies: Internet Population and Penetration
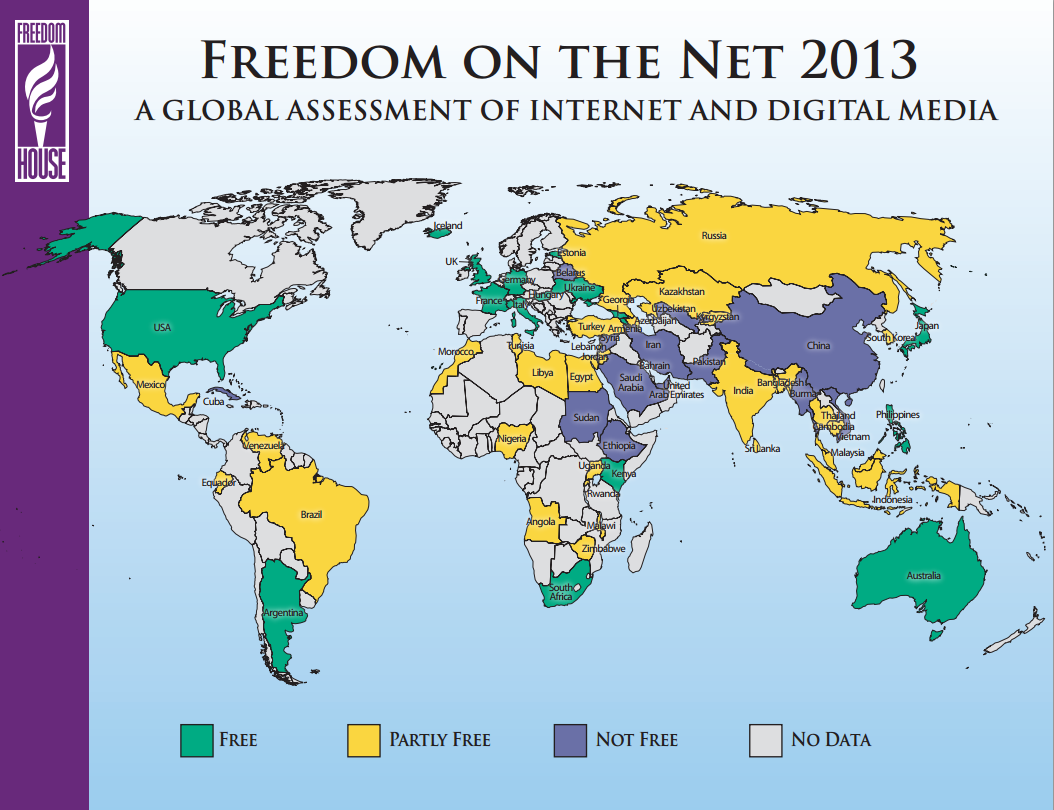
Freedom House has conducted a study on internet freedom in 60 countries across the globe.
What the authors of the study found is that global internet freedom has deteriorated in the last three years as a consequence of the increase of laws and regulations that try to limit free speech on the web.
An estimated 34 countries have seen a decline in internet freedom since 2012 including Vietnam, Ethiopia, Pakistan, and Venezuela. On the other hand, 16 countries have seen an improvement in internet freedom, among them Morocco, Burma, and Tunisia. Despite those improvements, limits on internet freedom are still rampant in many countries that make the list, where censorship, threats, and murder of bloggers and users who post information governments see as a threat continues.
Source: Freedom House: Freedom on the Net 2013

Google, Facebook, and Chinese search engine Baidu are the top three most visited websites in the world.
Using freely available website traffic statistics from Alexa, the authors of the map above found that most people in North America, Europe, South East Asia, and Oceania prefer Google. Due to the large number of Internet users in China and South Korea combined, an estimated one billion users, Baidu is the most visited website behind Google. Facebook comes in third with an estimated 280 million users spread from Latin America to the Middle East.
Source: Information Geographies: Age of Internet Empires
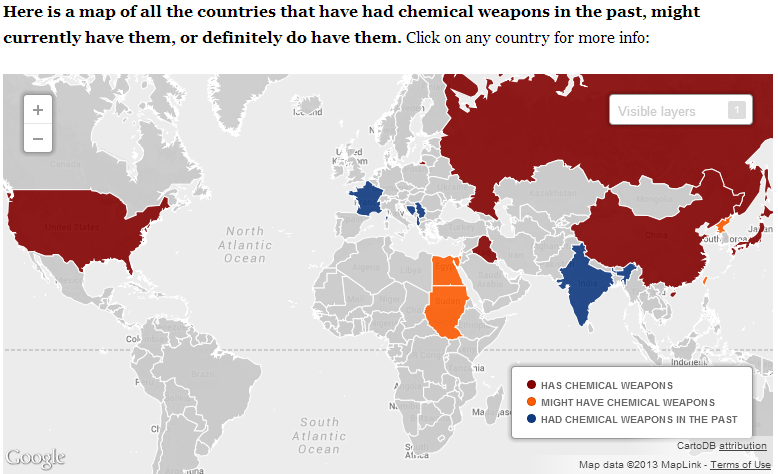
The 1925 Geneva Protocol banned the use of chemical weapons in warfare. By 1993 the Chemical Weapons Convention asked signatory nations to destroy their existing chemical weapons stockpiles and stop producing new ones.
Of the signatories, the United States and Russia are the two countries with the largest chemical weapon stockpiles. Currently, they are in the process of destroying them. Among the signatory states that have not yet ratified the Convention we find Israel and Myanmar. States that have not signed the Convention include Angola, Egypt, North Korea, South Sudan, and Syria.