Tag Archives: Hong Kong

The Most Expensive Office Locations by Country

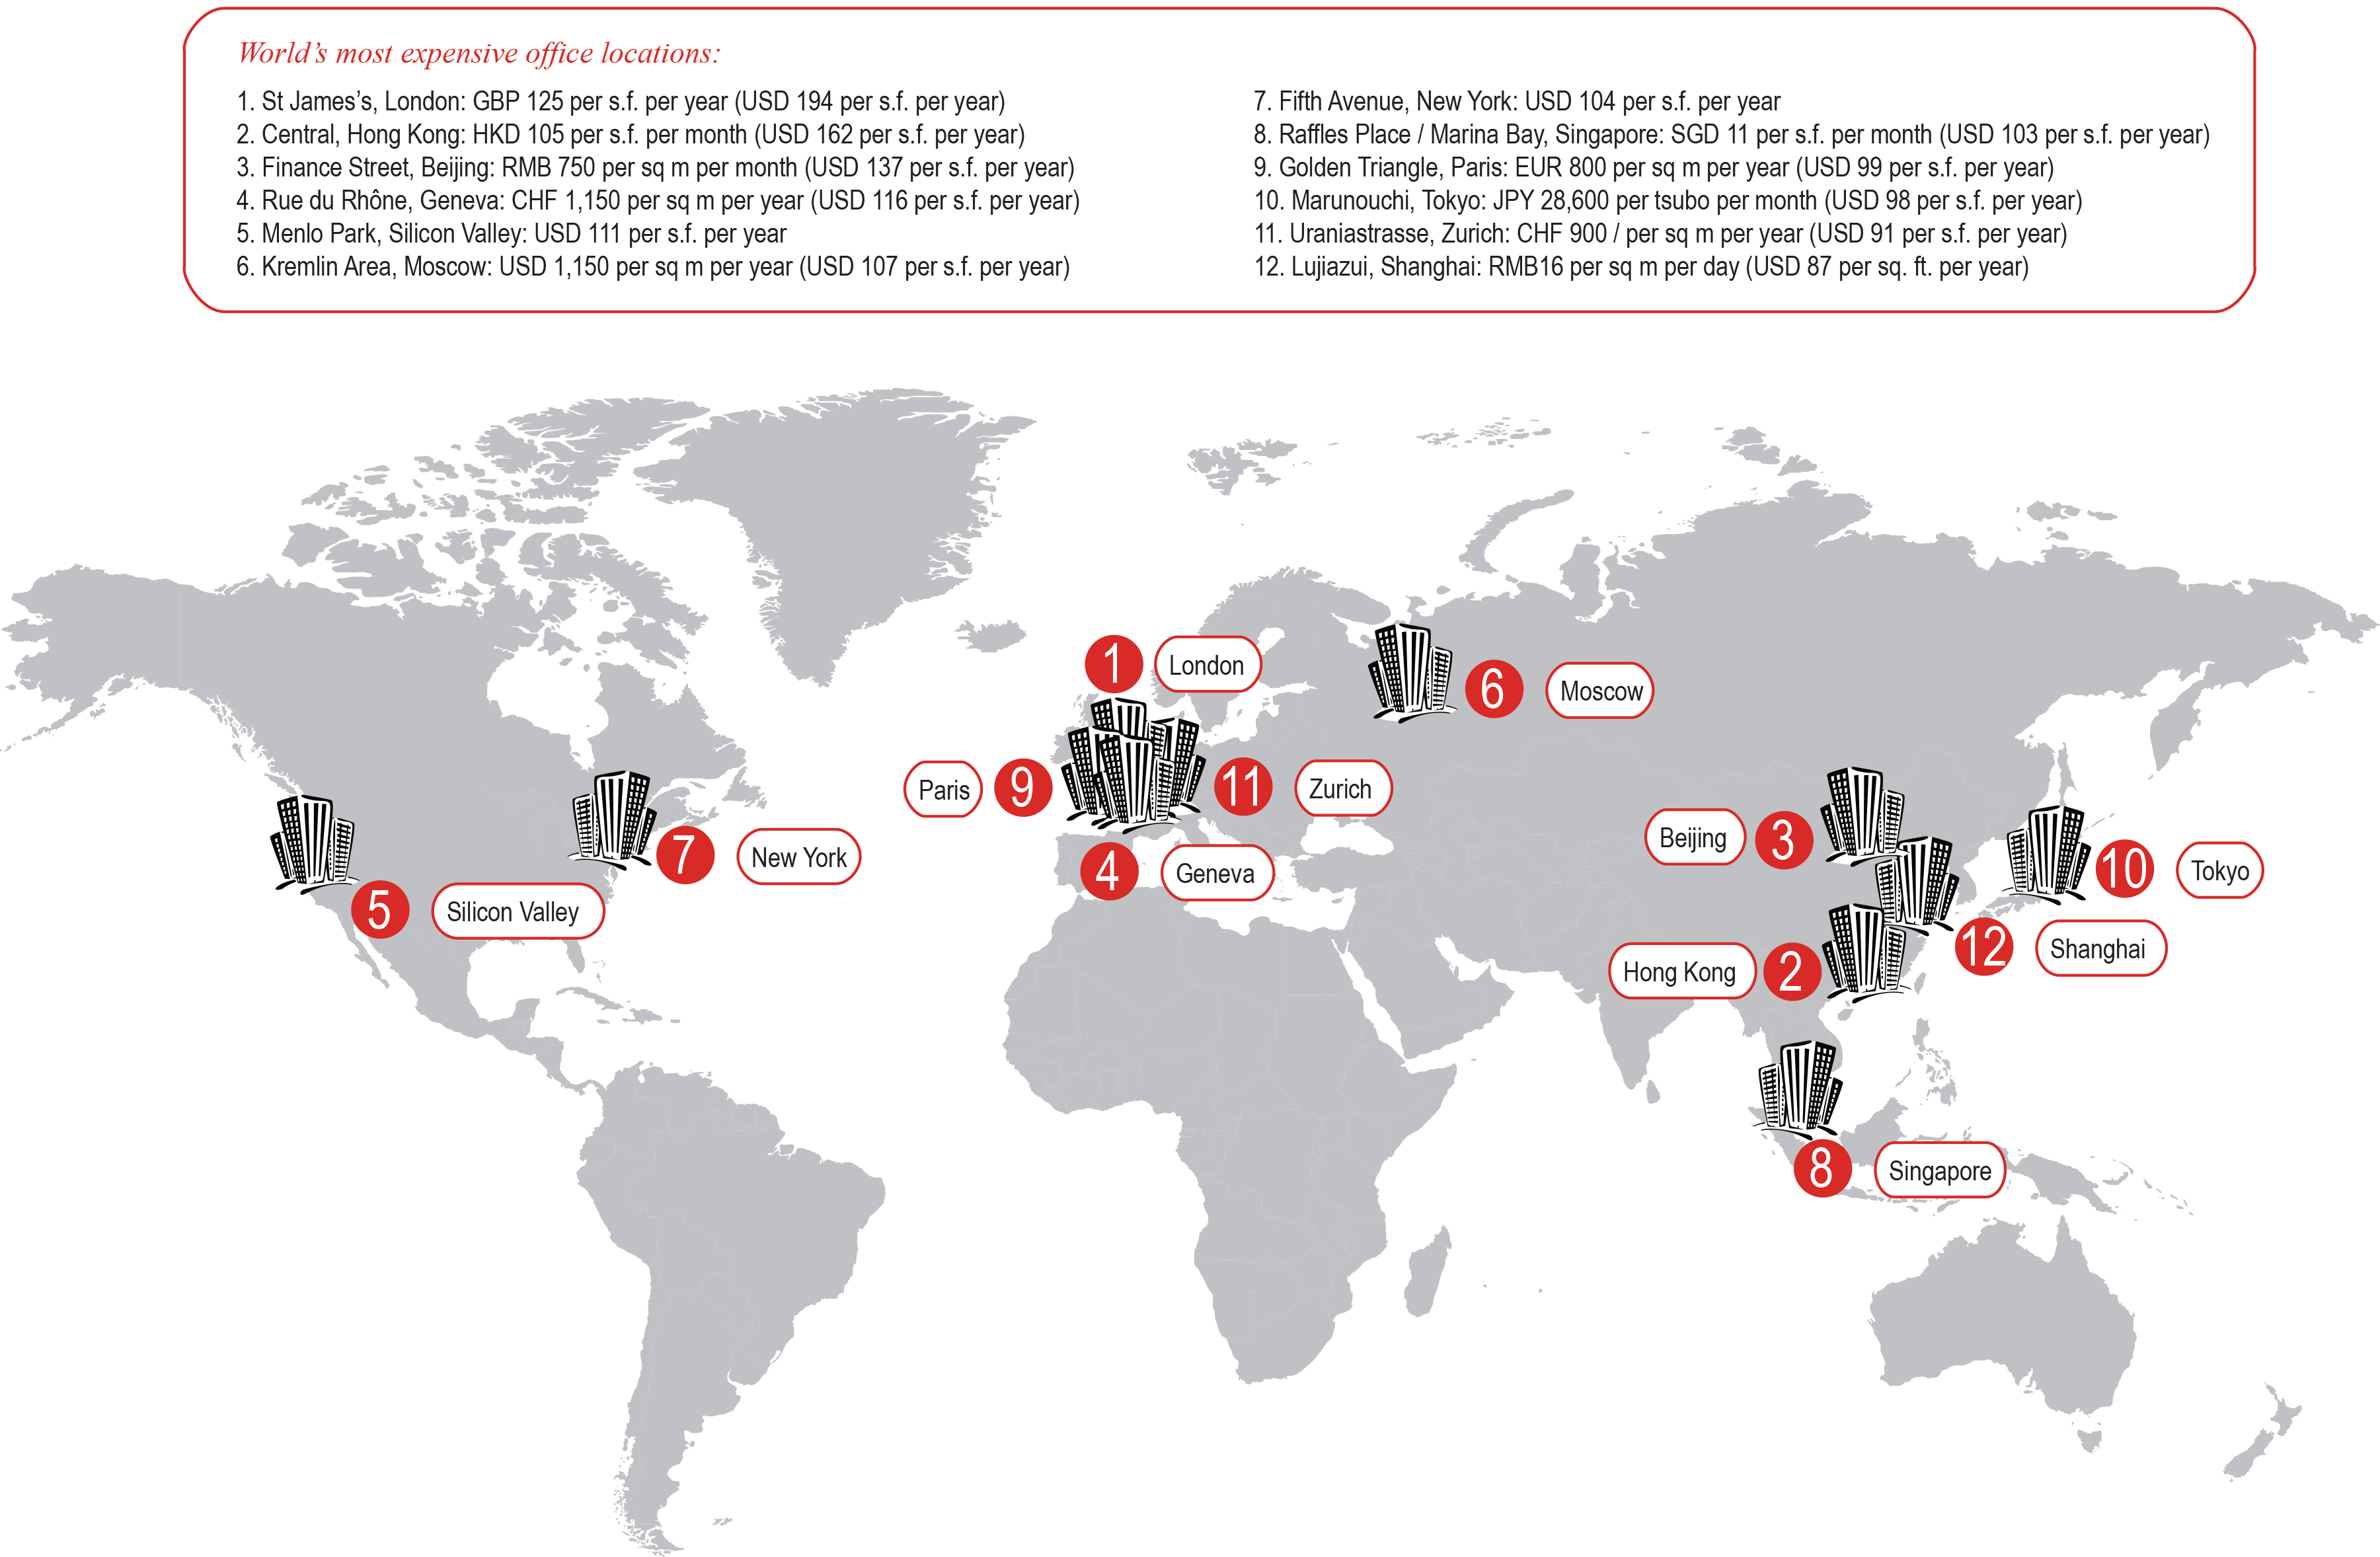
World's most expensive office locations

Expensive office locations around the world share similar characteristics: they are located in premier trade and financial centers, they are sites for corporate headquarters, they are located in areas where property availability is scarce and therefore expensive, and they are located close to their most wealthy customers.

As we can see in the map above, the most expensive office spaces are located in Europe, Asia and the United States. London’s St. James area leads as the most expensive location for office space. London is followed by Hong Kong’s Central area, Beijing’s Finance Street, Geneva’s Rue du Rhône, and Silicon Valley’s Menlo Park.

Source: LinkedIn: Paying the Rent: The World’s 12 Most Expensive Office Locations
 

The Economic Freedom Index 2013

economic freedom index

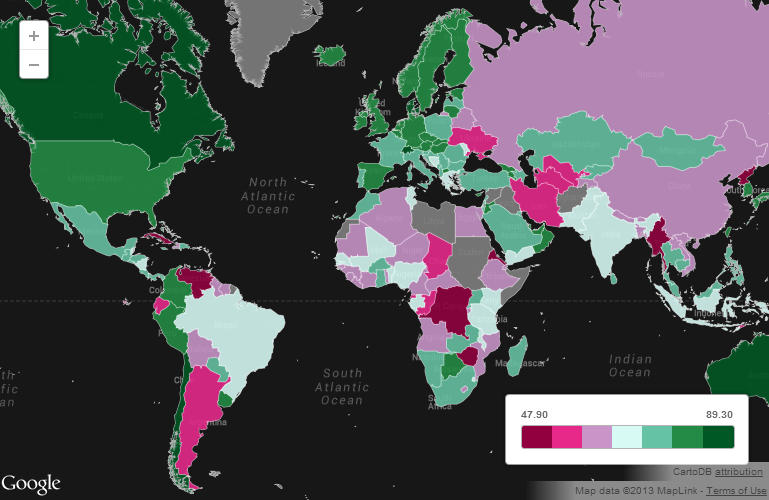
The Economic Freedom Index, compiled by the Heritage Foundation, is a measure of the economic freedom given to citizens in each of the 185 countries where it is measured. A total of ten components of economic freedom are considered, all grouped under four categories: rule of law, limited government, regulatory efficiency, and open markets.

The highest ranking country in the list is Hong Kong, with a score of 89.3, affording its citizens the highest degree of economic freedom in the world. Hong Kong is followed by Singapore, Australia, New Zealand, Switzerland, Canada, Chile, Mauritius, Denmark, and the United States, among the top ten.

On the opposite side, the most repressed countries in terms of economic freedom include North Korea, Cuba, Zimbabwe, Venezuela, Eritrea, and Burma.

Source: International Business Times: US Economic Freedom Is At Lowest Point Since 2000 [MAP]


The Higher Cost of Higher Education

higher-education-international-studentsStudying abroad can be very expensive, specially if you are looking at universities in Australia or the United States.

The average cost of higher education for international students is very high in Australia, where a student is expected to pay a total of $38,516 in annual fees and cost of living. Australia is followed by the U.S. where the average cost of one year of higher education is estimated at $35,705. Other countries with a steep tab on higher education include the United Kingdom, Canada, Japan, Singapore, and Hong Kong.

On the other hand, more affordable higher education can be found in Germany, where the average cost of one year of college annual fees plus cost of living is estimated at $6,285. Other countries with affordable higher education include Spain, Taiwan, China, and Russia.

Source: International Business Times- International Students: Higher Education Is Really Inexpensive In Germany, But Not In The US [CHARTS]


Extradition Treaties of the U.S. with Other Countries

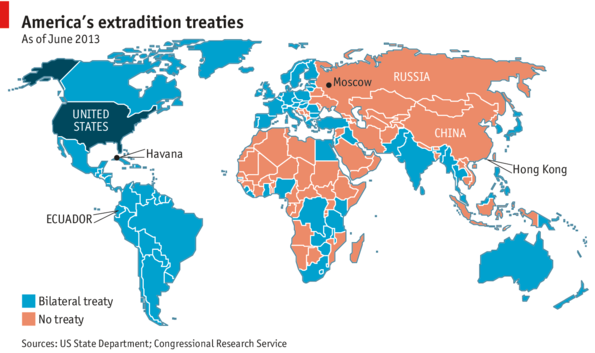
american extradition treatiesAn estimated 100 countries have signed bilateral extradition treaties with the United States, including all Latin American countries, Western European countries, Egypt, India, Australia, and New Zealand to name a few. Some 60 nations including China, Russia, several Middle Eastern and African countries have not. However, even if some countries signed extradition treaties they can still refuse to hand an individual over to the U.S. if that person is seeking asylum or if he/she would face the death penalty.

Source: The Economist: Daily Chart: Where can he go?


Wealth Comparison for the Years 1500 and 2015

wealth year 1500

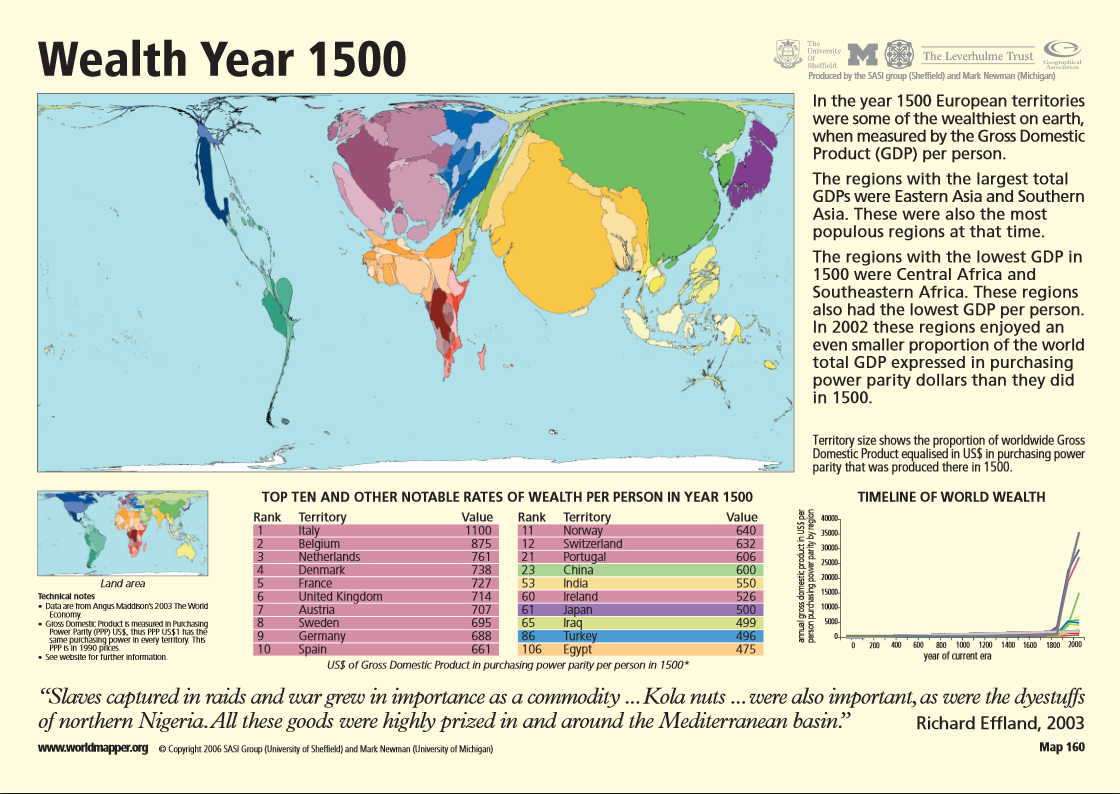
wealth year 2015Comparing the levels of wealth per person for the years 1500 and 2015, as shown in these two maps, it is interesting to see how economic power has shifted from some nations to others.

Back in the 1500s, economic power was held by a majority of European nations leaded by Italy. China ranked number 23, India 53, and Japan 61. North America’s wealth was negligible compared to Europe’s, but the African region enjoyed more wealth than they do today.

A forecast for the year 2015 places Taiwan, Hong Kong, and Singapore at the top in GDP per capita. Some European nations are still wealthy, such is the case of Malta, Luxembourg, Norway, and Ireland, but Italy is not in the lead anymore. Japan’s wealth per capita has increased, and so has the United States’, but the wealth of African countries has become the lowest worldwide.

Source: Global Finance: Wealth Distribution and Income Inequality by Country


The 50 Largest Ports in the World

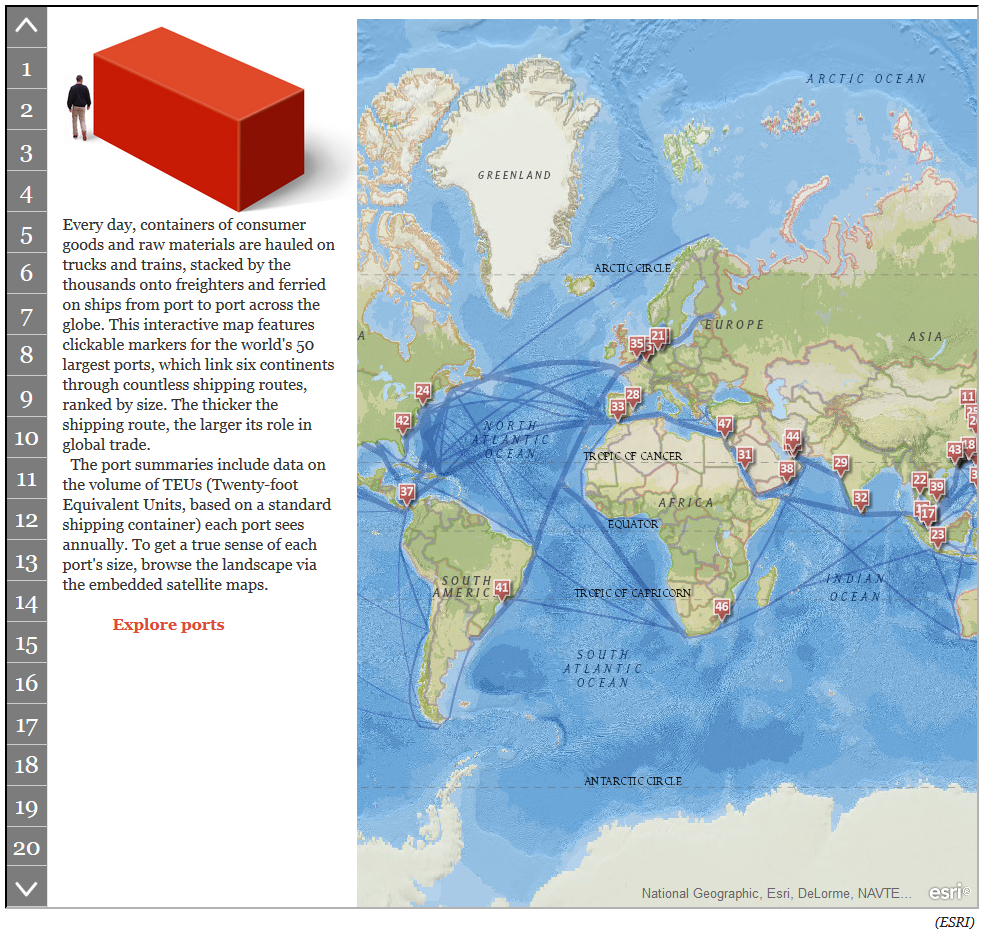
worlds 50 largest portsEvery day finished goods and commodities are transported  by sea in shipping containers from one port to another across the globe. Standard shipping containers measure 20 feet long by eight feet wide, hence they receive the name of “Twenty-foot Equivalent Units” or TEUs.

The largest port in the world is in Shanghai (China) which saw a volume of 31.74 million TEUs of cargo freight passing through its port in 2011. Shanghai is followed by Singapore (Singapore) which saw a volume of 29.94 million TEUs passing through its port for the same year. Singapore is followed by Hong Kong, Shenzhen (China), Busan (South Korea), Ningbo, Guangzhou, and Qingdao (China), Dubai Ports (United Arab Emirates), and Rotterdam (Netherlands), all in the top ten.

For the interactive map, that allows you to explore each one of the largest 50 ports in the world, visit: The Smithsonian: Interactive: The 50 Largest Ports in the World


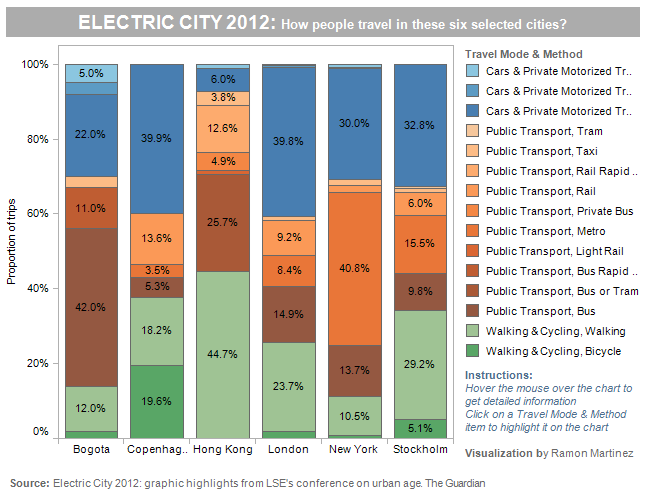
Ways of Transportation in Six Selected Cities

Interesting transportation patterns emerged from the 2012 LSE Cities conference, which focused in the way cities across the globe adjust to technological innovation and environmental changes.

The graph above displays transportation patterns for six selected cities: Bogota, Copenhagen, Hong Kong, London, New York, and Stockholm. Of the six selected cities, Hong Kong is where walking and biking are the most common ways of transportation, a good 44.7%, and where cars and other private motorized vehicles are used the least (7.2%). Copenhagen and London, are the cities where the most common way of transportation are cars and other private motorized vehicles (39.9% and 39.8% percent respectively). New York city and Bogota are the cities where public transportation is most commonly used (57.9% and 56% respectively). In Stockholm, all three ways of transportation (walking/biking, private cars, and public transportation) are used almost in similar proportion.

For more detailed information visit: