Tag Archives: India

Things Each Country Leads the World In

what each country leads the world in

Each country leads the world in different things, from good to bad things to awkward ones.

According to the map above, France leads the world in tourism, India in making movies, Saudi Arabia in oil reserves, the United States in producing Nobel laureates, Greece in olive oil consumption, Switzerland in the rate of employment, Norway in democracy, Brazil in FIFA world cup titles, and Costa Rica in happiness, to name a few.

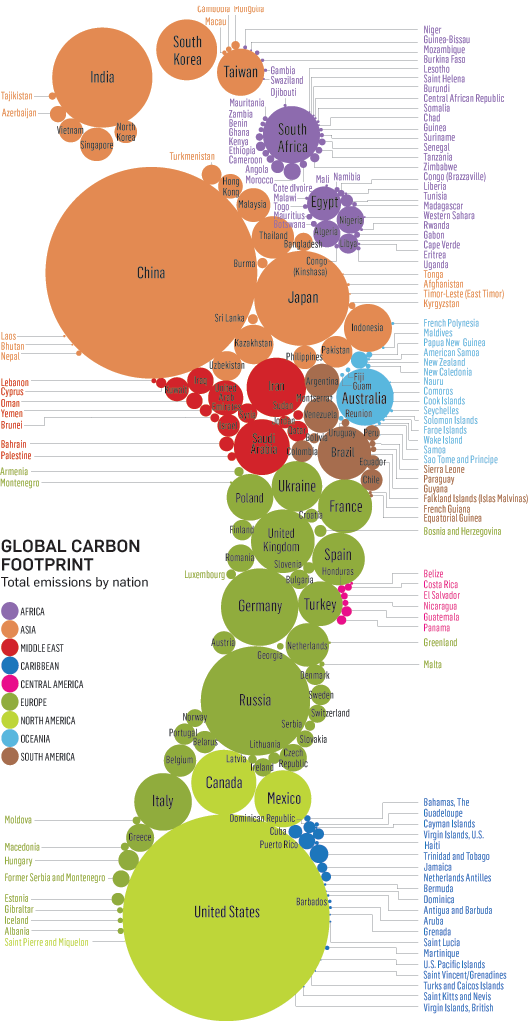
Other countries lead in not so positive things. For example, Russia leads in the number of nuclear warheads, China in carbon emissions, Afghanistan in opium production, North Korea in censorship, and Yemen in gender inequality.

Among the awkward we find Venezuela leading in the number of miss universe titles, Argentina in exporting soccer players, Netherlands in the tallest people, Iran in the highest brain drain, Sweden in atheism, and Mexico in lightning strikes.

Source: Policy Mic: This Map Shows the Weird Things Each Country Leads the World In


The Global Slavery Index 2013

global slavery index 2013

Slavery still exists in many parts of the world, whether it be in the form of forced labor, forced domestic servitude, sexual exploitation, debt bondage, bonded labor, or child marriage.

The Global Slavery Index provides insight into the number of people enslaved in 162 countries. The index takes into account three indicators: the prevalence of slavery per population, child marriage, and human trafficking.

India is a the top of the list with the largest absolute number of enslaved people, an estimated 14 million. China comes in second place with an estimated 2 million people enslaved. Pakistan is in third place with an estimated 2.1 million people in slavery. These countries are followed by Nigeria, Ethiopia, Russia, Thailand, Democratic Republic of Congo, Myanmar and Bangladesh. Put together, these countries account for 76% of the total enslaved people, or 29.8 million people, in the 162 countries that make up this ranking.

Source: Walk Free Foundation: The Global Slavery Index 2013


Minutes of Minimum-Wage Work to Buy a Big Mac Burger

minutes of work for a big macUsing the criteria of the Big Mac Index developed by The Economist in 1986 as a way to measure if currencies are valued at the right level, the International Business Times created this visualization showing how many minutes a minimum-wage worker needs to work in order to buy a Big Mac burger.

As it turns out, a minimum-wage worker in Afghanistan needs to work 372 minutes (6.2 hours) in order to buy a Big Mac burger. In contrast, a minimum-wage worker in Australia needs to work only 18 minutes to buy a Big Mac burger.

Source: International Business Times: Minutes Of Minimum-Wage Work To Buy A Big Mac: 36 minutes in the US, 6 hours in Afghanistan


Oil Production and Consumption by Country

oil production and consumption since 1965When it comes to oil production and consumption, countries have a very close relationship of interdependence with each other. Some countries consume more oil than what they produce relying on imports to satisfy their internal demand. Others, consume less than what they produce, being able to export oil to nations that need it.

Oil consumption (yellow) for the United States, for example, was larger than its production (grey) for 2012, 18.55 mb/d (million barrels per day) compared to 8.9 mb/d, importing more than double its production to satisfy the gap in internal demand. Other nations with oil consumption higher that oil production include China, Brazil, Australia, India, UK, and Indonesia.

In contrast, oil consumption for Saudi Arabia for 2012 is estimated at 2.94 mb/d, while its production reached 11.53 md/d, exporting its oil surplus to the rest of the world. Other nations whose oil production exceeds its oil consumption include Canada, Mexico, Venezuela, Norway, Russia, Kuwait, United Arab Emirates, and Qatar.

Source: Winston Smith Labs: Global Oil Production and Consumption since 1965 [Interactive Map/Graph]


Worldwide Remittance Flows

world remittance flows 2012Remittances, or money sent by migrant workers to their home countries, have increased since the year 2000. Although, they temporarily decreased after the economic crisis back in 2008, they recovered in 2010 and continued to rise. Remittances increased from $204 billion back in 2000 to $540 billion in 2012.

Countries with the highest remittance inflows include India ($71 billion), China ($62 billion), Mexico, the Philippines, Nigeria, Egypt, and France. Only nine countries saw a reduction in remittance inflows, among them Greece and Turkey which experienced the steepest decline.

For the interactive map, please visit: Tages Woche: The incredible rise of migrants’ remittances


Basic Salary of Lawmakers by Country

basic salary of lawmakers by country 2013How much lawmakers are paid is a sensitive issue especially in times of economic austerity, or in countries where the majority of the population lives in extreme poverty conditions.

In this chart prepared by The Economist, we can see how much lawmakers are being paid in different countries across the globe in U.S. dollars (left), and as a ratio of the gross domestic product (GDP) per capita (right).

In Nigeria, for example, lawmakers receive a basic salary of $189,000, 116 times the country’s GDP per capita. In Kenya a lawmaker makes a basic salary of $74,500, 76 times the country’s GDP per capita. Other countries were lawmakers receive the heftiest salaries include Ghana, Indonesia, South Africa, Brazil, Thailand, and India. It is worth pointing out that most of these countries are some of the poorest in the world.

In comparison, in the wealthiest nations a lawmaker’s salary as a ratio of GDP is much smaller. In Britain, that ratio is 2.7 of the GDP per capita.


Global Carbon Footprint by Country

carbon footprint by countryThis original visualization by Stanford Kay shows total carbon emissions by country. Using different colors to differentiate each region, the size of the circle depicts the carbon footprint of each country.

Countries with the largest carbon footprint include China, United States, Russia, India, Japan, Germany, South Korea, Australia, UK, Iran, Saudi Arabia, Brazil, Taiwan, Ukraine, France, and Spain.


Consumption of Spirits by Country

highest consumption of spiritsThe Economist compiled a visualization of the highest consumption of selected spirits worldwide. The selected spirits include vodka, rum, scotch whiskey, gin, and tequila.

The largest consumer of vodka is Russia, followed by the United States, Ukraine, Poland among others. The largest consumer of rum is India, followed by the United States, Philippines, and Cuba. The largest consumers of scotch whiskey, gin, and tequila are France, Philippines, and the United States respectively.


World Production of Rare Earth Metals

the future global supply of rare earth elementsRare earth metals or rare earth elements are a collection of seventeen chemical elements located at the bottom of the periodic table. They are key elements in the manufacture of high technology components, hybrid cars, solar panels, lasers, electronics, etc.

As of 2010, China produced 97% of the total world production of rare earths, or 130,000 metric tons, followed by India (2%), Brazil (0.42%), and Malaysia (0.27%).

The estimated demand for rare earths for 2015 will increase 54% compared to the demand in 2010.

Source: GOOD: Infographic: The Future Global Supply of Rare Earth Elements

See also: IndexMundi: Commodities Glossary – Rare Earth Metals


The Most and Least Racially Tolerant Countries

racial-tolerance-mapA survey conducted by two Swedish economists asked respondents in 80 countries what kind of people they would not like as neighbors, to which many replied “people of a different race”.

The results from that survey are displayed in this map published by the Washington Post. According to the survey, people in English-speaking, Scandinavian, and Latin American countries are the most racially tolerant, with the exception of Venezuela. South Africa shows to be a tolerant country, while the attitudes in Europe show a lot of variation. People in countries such as France, Turkey, India, Jordan, Saudi Arabia, Egypt, Nigeria, South Korea, and Indonesia are the least racially tolerant.