Tag Archives: USA

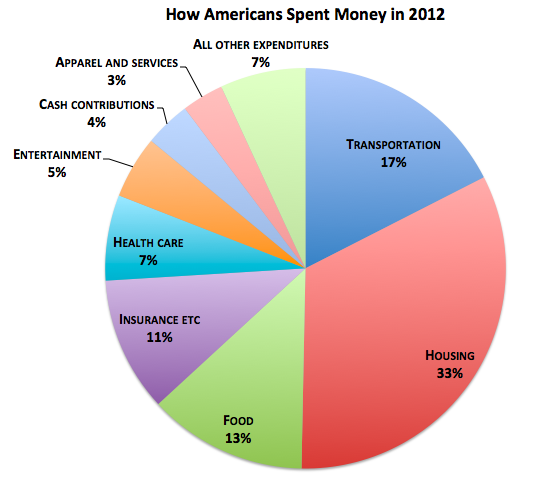
How Americans Spent Money in 2012


how americans spend money

Housing, food, transportation, and clothing account for an estimated 66% of income spent for an average American household in 2012.

According to The Atlantic, housing, food and clothing account for more than 60% of expenses for the poor. Basically, most of their income is spent is covering basic needs and not much, or none, is left for savings. The rich, by contrast, have a larger margin that can be spent in entertainment, insurance, and savings.

Source: The Atlantic: Where Americans—Rich and Poor—Spent Every Dollar in 2012


Women’s Earnings by State

gender-pay-gap-graphic-final

Comparing the median earnings of full-time employed women to the median earnings of full-time employed men in the U.S., we can see there is still a gender pay gap, where women earn 77 cents per each dollar earned by their white male counterparts. This number has remained unchanged for the last ten years.

In some states women earn slightly more. That is the case for the states of Nevada (84 cents per dollar), California, Vermont, and New York. On the other side of the spectrum, there are states where women earn much less than the median. That is the case of Wyoming (64 cent per dollar), and Louisiana (67 cents per dollar).

Source: Forbes: The Geography Of The Gender Pay Gap: Women’s Earnings By State


The United States Leads in Mobile Monetization

us leads in mobile monetizationAccording to Statista global revenue from mobile advertising almost doubled in 2012, increasing from $4.9 billion back in 2011 to $9.1 billion.

In North America alone, the amount spent on mobile ads per mobile subscription reached $9.39 on 2012 compared to $4.53 on the previous year. That fact puts North America as the leader in mobile advertising worldwide. Western Europe follows with $2.91 spent on mobile ads per mobile subscription, more than double the amount spent on the previous year.


Stock Performance of Selected Internet Companies in 2013

stock performance of selected internet comanies 2013The year 2013 has been a good year, so far, for selected internet companies. In this chart by Statista we can see the percentage change since January 2013 to July 12, 2013 for the stock performance of companies like Yahoo, Google, Amazon, etc.

The best performer has been LinkedIn with a 77.5 percentage change since January 2013. LinkedIn is followed by Yahoo, Google, AOL, Amazon, and eBay. Facebook, on the other hand, has seen a decline in its stock performance in the same period of time.


U.S. Mobile Phone Subscribers Talk the Most

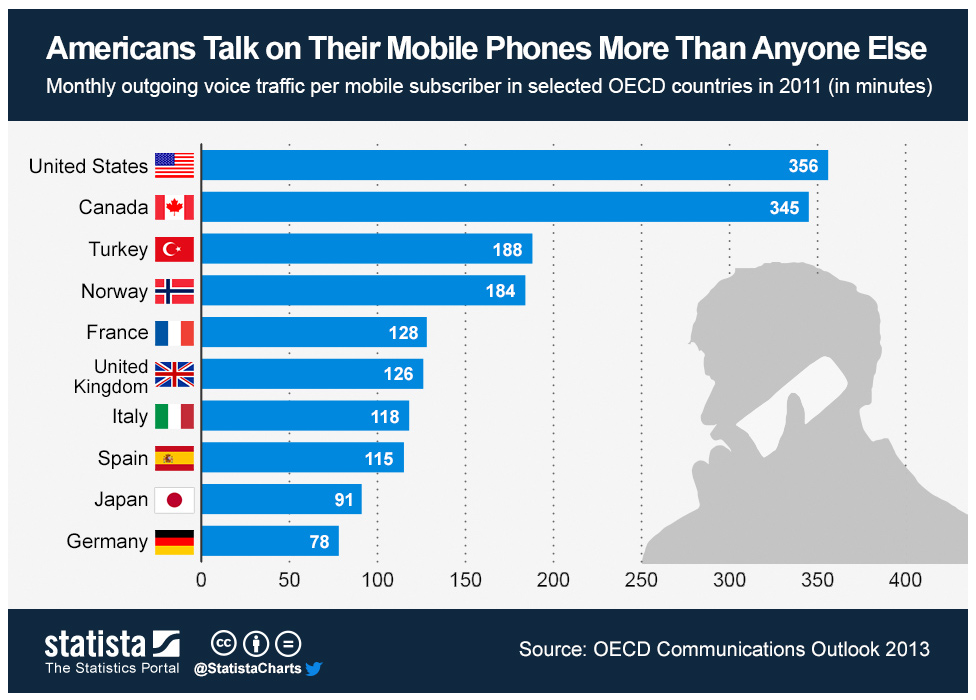
americans and the mobile phoneOn average, U.S. mobile subscribers talk on the phone 356 minutes, or roughly 6 hours per month. That number is double that of the Turkey, and 4.5 times that of Germany. That estimate is the highest among selected OECD countries.

Canadians are not far behind. The outgoing traffic per mobile subscriber is an average 345 minutes (5 hours and 45 minutes) in a single month.

 Source: Statista: Americans Talk on Their Mobile Phones More Than Anyone Else


World Population Growth Over Time

population growth over time 1800-2050

World population growth accelerated in the last century. During the twentieth century alone, the number of people increased from 1.5 billion to 6 billion.

In the year 1800 the world’s population had reached 1 billion, with most people living in Asia and Europe. By 1927, 127 years later, the population of the world had doubled, reaching an staggering 2 billion people.
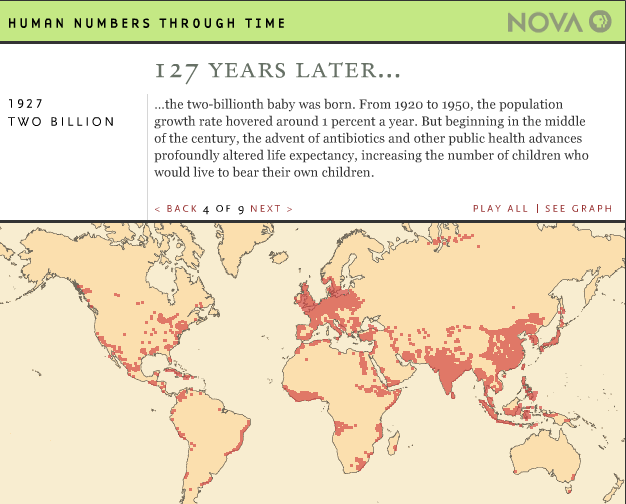
population growth over time 1927Population growth remained almost the same until 1950 when advances in science and medicine increased life expectancy, specially in developed nations.

The world’s population reached 3 billion inhabitants by 1960, 4 billion by 1974, 5 billion by 1987, 6 billion by 1999, 7 billion by 2011.
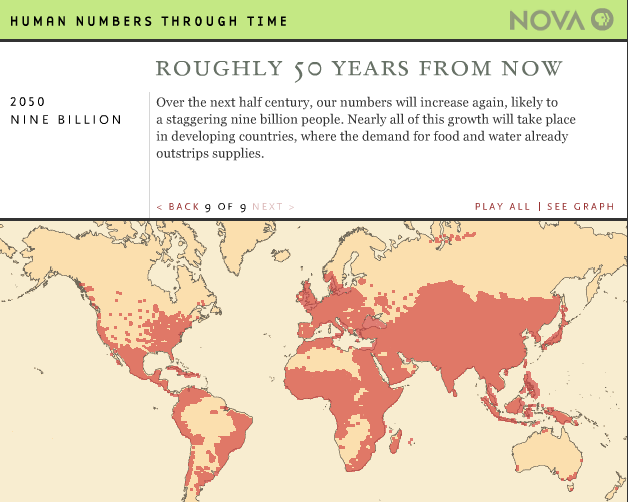
population growth over time 2050It is estimated that the population of the world will reach 8 billion by 2024, and 9 billion by 2050. Most of the growth will occur in developing nations

Source: NOVA: Human Numbers Through Time
 

Iconic Alcoholic Beverages by State

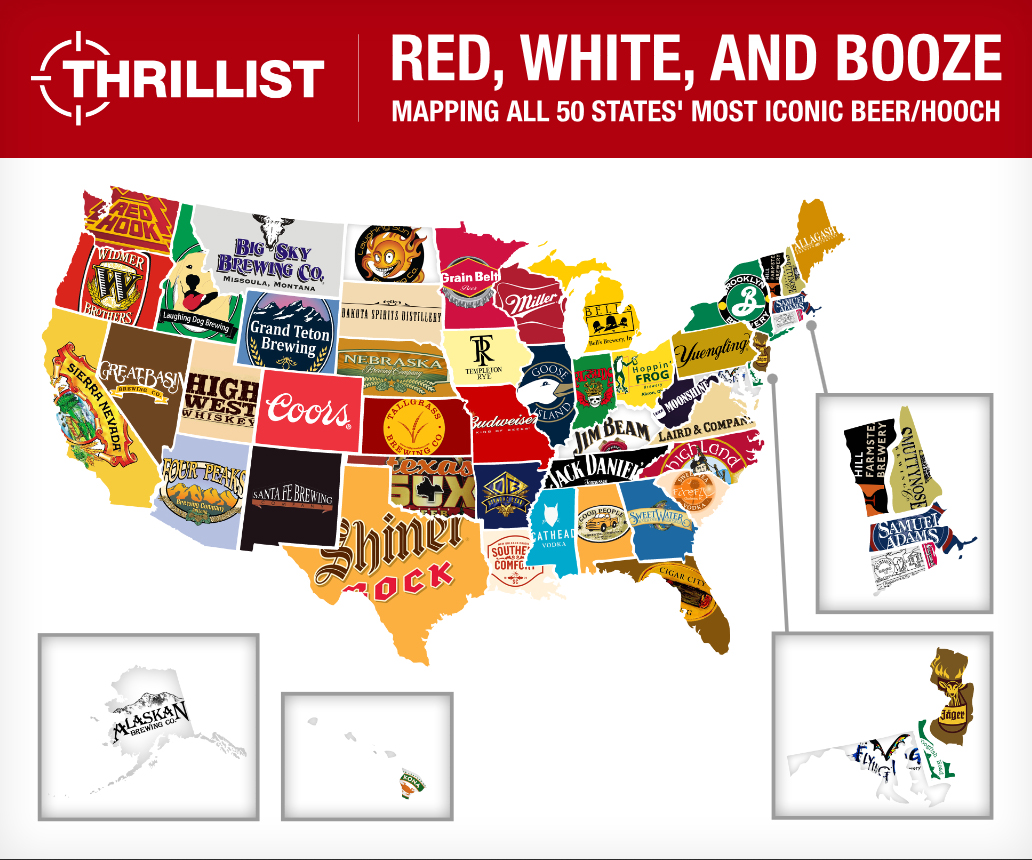
us favorite beer brands by state 2013This map prepared by Thrillist shows each state in the U.S. according to their most famous beer or alcoholic beverage brand.

In that sense, California is most famous for Sierra Nevada, Texas for Shiner Rock, Colorado for Coors, Massachusetts for Samuel Adams, Tennessee for Jack Daniels, Missouri for Budweiser, West Virginia for moonshine, Pennsylvania for Yuengling, and Wisconsin for Miller.


Global Carbon Footprint by Country

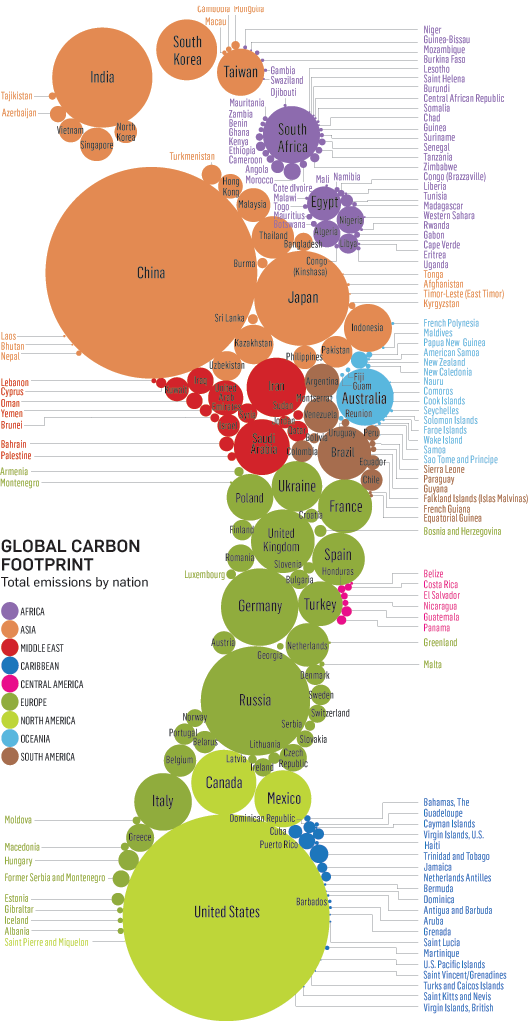
carbon footprint by countryThis original visualization by Stanford Kay shows total carbon emissions by country. Using different colors to differentiate each region, the size of the circle depicts the carbon footprint of each country.

Countries with the largest carbon footprint include China, United States, Russia, India, Japan, Germany, South Korea, Australia, UK, Iran, Saudi Arabia, Brazil, Taiwan, Ukraine, France, and Spain.