Tag Archives: population

World Population Growth Over Time

population growth over time 1800-2050

World population growth accelerated in the last century. During the twentieth century alone, the number of people increased from 1.5 billion to 6 billion.

In the year 1800 the world’s population had reached 1 billion, with most people living in Asia and Europe. By 1927, 127 years later, the population of the world had doubled, reaching an staggering 2 billion people.

population growth over time 1927
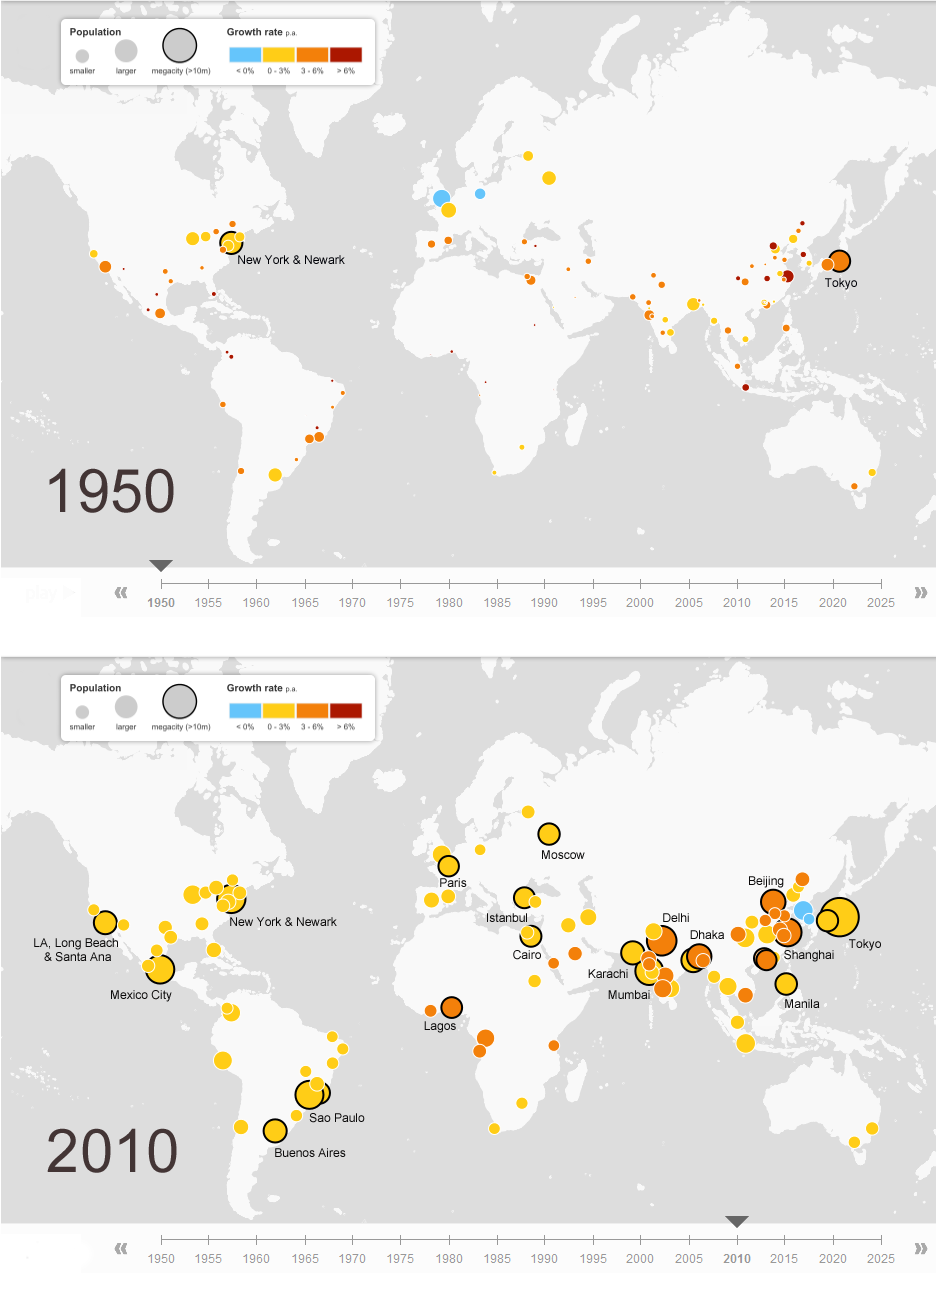
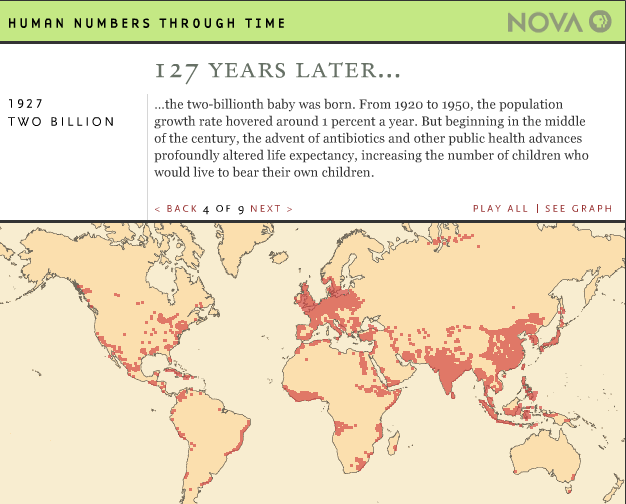
Population growth remained almost the same until 1950 when advances in science and medicine increased life expectancy, specially in developed nations.

The world’s population reached 3 billion inhabitants by 1960, 4 billion by 1974, 5 billion by 1987, 6 billion by 1999, 7 billion by 2011.

population growth over time 2050
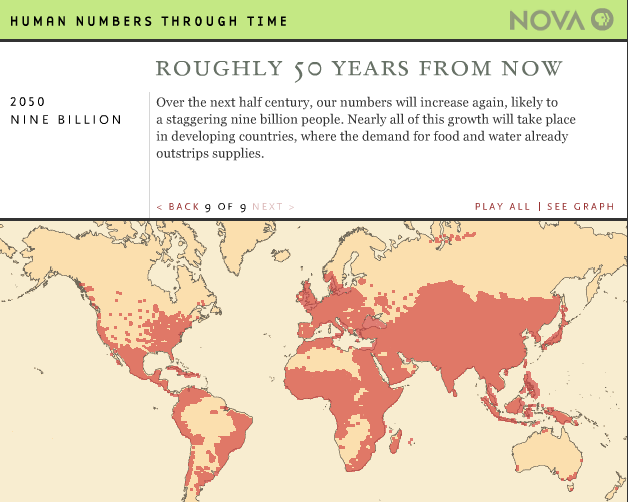
It is estimated that the population of the world will reach 8 billion by 2024, and 9 billion by 2050. Most of the growth will occur in developing nations

Source: NOVA: Human Numbers Through Time


Internet Connectivity in the United States

As part of the PBS series America Revealed, this aerial visualization shows the patterns of internet distribution in the United States. We can see that the regions with highest levels of internet connectivity include the Northeast, and parts of the South and Midwest, followed by the Pacific West.

For additional interesting aerial visualizations, such as the distribution of the unemployed, electricity network routes, public transportation paths, U.S. imports and exports of beef patterns, the distribution of the population in towns and cities, etc., visit: The Roosevelt’s – Aerial Data Visualisation Reveals Life In The United States.

North Korea vs. South Korea

In this visualization created by The Guardian, we can see how North Korea compares to South Korea in terms of population, Gross Domestic Product (GDP), life expectancy, freedom of the press, military spending, internet connectivity, infant mortality, among other indicators.

North Korea is a poor country with half the population of South Korea. It is one of the worst countries in terms of corruption and freedom of the press. Its military spending constitutes approximately 22.3% of its GDP, compared to 2.8% for South Korea.

Additional resource: IndexMundi: South Korea vs. North Korea – Country Comparisons


The World as 100 People

In this interesting infographic, created by Jack Hagley, we take a look at the world as if the total population of the world was 100 people. The information presented covers topics such as the distribution of gender, information, spoken languages, literacy, religion, age, housing, water, nutrition, and population inhabiting each continent.


Number of Doctors per 1,000 People per Country

The map above, created by the World Health Organization (WHO), shows the number of physicians per 1,000 people (for the latest available year) across the globe.

Countries with the largest number of physicians per 1,000 population include: San Marino (47.35), Cuba (6.72), Greece (6.17), Monaco (5.81) and Belarus (5.18).

Countries with the smallest number of doctors per 1,000 people include: Colombia, Nicaragua, Haiti, Liberia, Niger, sierra Leone, Rwanda, Ethiopia, Yemen, Afghanistan, Myanmar, Thailand, Cambodia, Indonesia, Papua New Guinea, etc.

Megacities Around the World

click to enlarge

Back in 1950, New York and Tokyo were the only two megacities, with populations larger than 10 million inhabitants. By 2010 the number of megacities had increased to 23, including cities like Mexico City, Los Angeles, Sao Paulo, Rio de Janeiro, Buenos Aries, Paris, Moscow, Cairo, Istanbul, Delhi, Karachi, Mumbai, Dhaka, Beijing, Shanghai, Manila, besides New York and Tokyo, the largest megacity with a population of 36.9 million. For 2025, it is estimated that there will be 29 megacities around the globe. Click here for the interactive map.


How Does Your Country Compare to U.S. States?

These interactive maps from the Economist provide an interesting comparison between different countries and US states.

Using the criteria of GDP (Gross Domestic Product), the economy of California is approximately the size of Italy, Texas the size of Russia, Florida the size of the Netherlands, and Alabama the size of Nigeria.

Using the criteria of Population, California is approximately the size of Poland, Washington  the size of Lebanon, Arizona the size of Libya, and Minnesota the size of Finland, to name a few.