Category Archives: Commodities

Why is barley an important commodity?

Barley is an important commodity for several reasons. It is a widely grown cereal crop and a major source of food, feed, and malt for brewing and distilling industries. Barley is a hardy crop that can grow in a variety of climates and soil types, making it well-suited to cultivation in many parts of the world. It’s a versatile crop that can be used in a variety of ways such as human consumption, animal feed, brewing, and malting. Barley is also an important ingredient in the production of beer, whiskey and other distilled beverages. It’s a valuable crop for farmers as well as for food and beverage industries.

See also:
Why is rice an important commodity?

Rice is an important commodity for several reasons. It is a staple food for over half of the world’s population, and is a major source of nutrition and caloric intake for people in many developing countries. Rice is also an important crop for small-scale farmers and rural communities, as it is relatively easy to grow and requires less water and land than many other staple crops. Additionally, rice is used in a wide range of cultural and traditional dishes, and its cultivation has social, economic, and environmental importance.

See also:

Why is corn an important commodity?

Corn is an important commodity for several reasons. It is one of the most widely grown crops in the world, and is a major source of food, feed, and fuel. Corn is a staple food in many countries, and is also used to feed livestock and produce ethanol for fuel. Additionally, corn is used in the production of a wide range of industrial products, including plastics, adhesives, and chemicals. It’s a versatile crop that plays a key role in the global economy.
See also:

Why is wheat an important commodity?

Wheat is a strategically important commodity because it is a staple food for a large portion of the world’s population. It is the fourth most-produced cereal crop globally, after corn, rice, and barley, and it is a major source of calories and protein for people in many countries. The demand for wheat is relatively inelastic, which means that changes in price do not significantly affect the quantity of wheat that is consumed. This makes it an important crop for farmers and a reliable source of revenue for countries that export it. Additionally, wheat is a key input for many processed foods and is used in a wide range of industrial and non-food products. Its role as important source of food, income, and other uses make it significant from strategic perspective.

See also:

China at the Top of Renewable Energy Investment

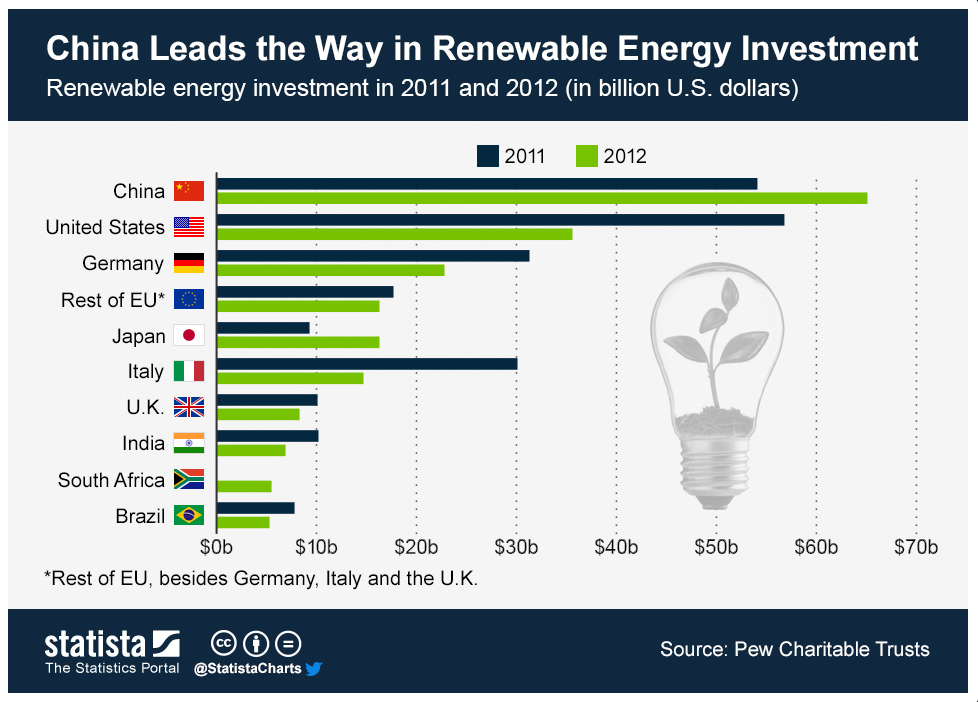
china leads energy investmentIn 2012 China’s investment in renewable energy surpassed the investment by the United States for the previous year and for the same year. In fact, China’s is ahead every other nation including Germany, Japan, and Italy.

China’s investment in renewable energy exceeded $60 billion for 2012, compared to an estimated $36 billion in the United States, and $23 billion in Germany for the same year.

Source: Statista: China Leads the Way in Renewable Energy Investment


Oil Production and Consumption by Country

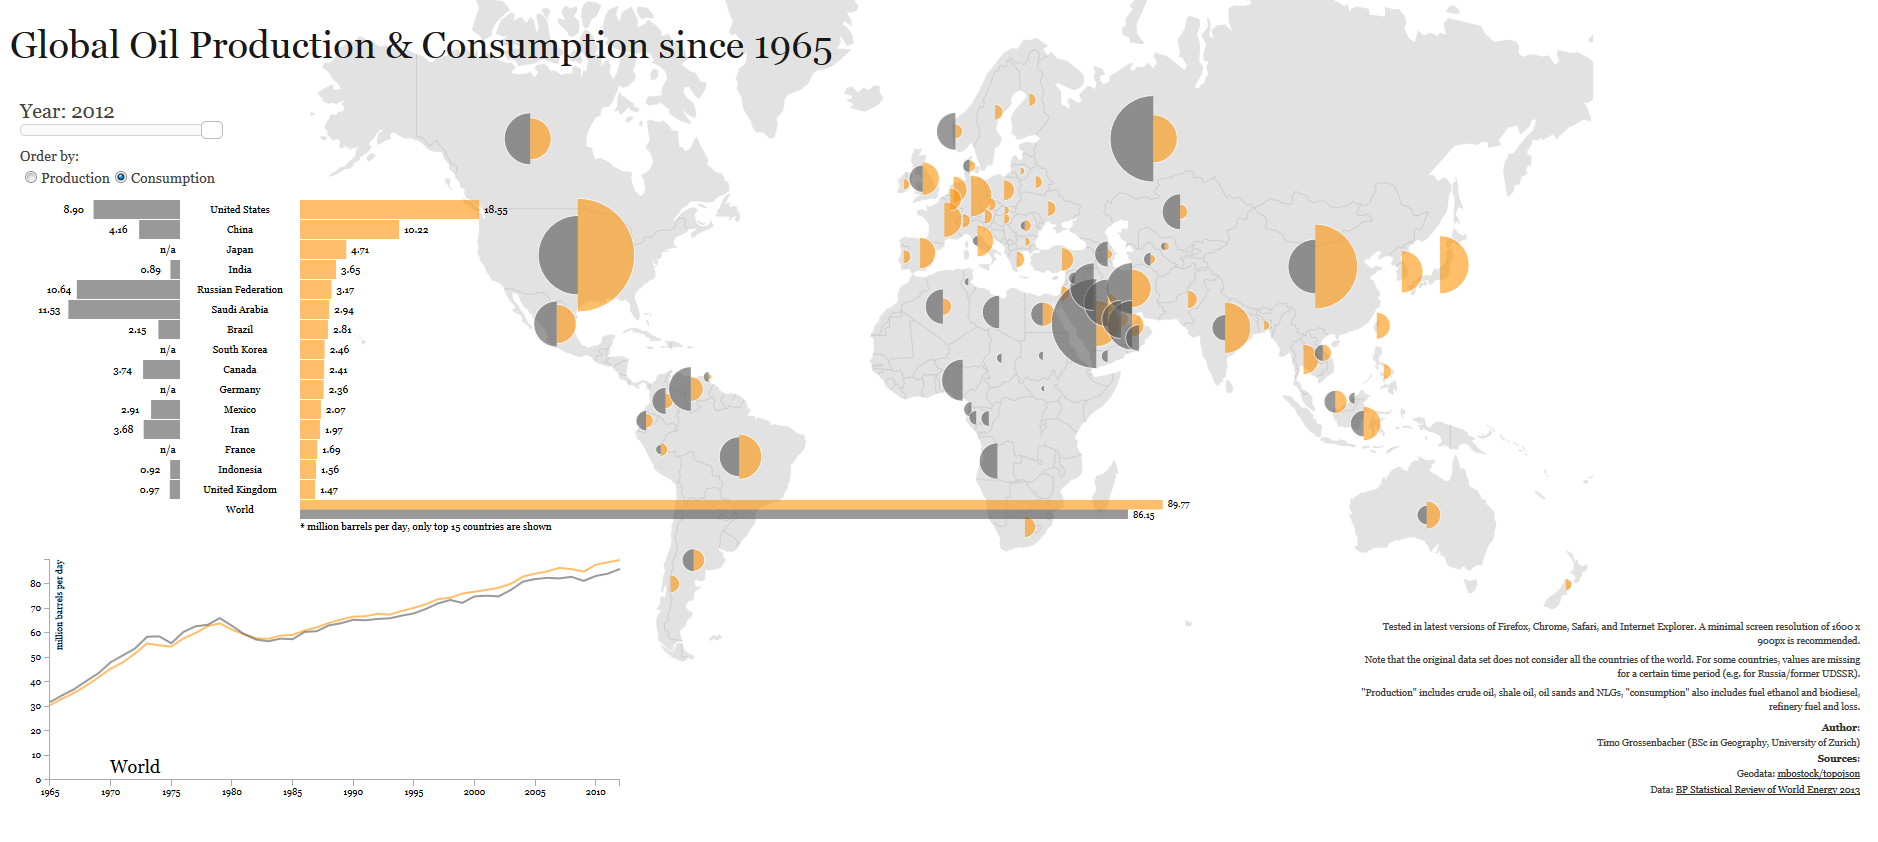
oil production and consumption since 1965When it comes to oil production and consumption, countries have a very close relationship of interdependence with each other. Some countries consume more oil than what they produce relying on imports to satisfy their internal demand. Others, consume less than what they produce, being able to export oil to nations that need it.

Oil consumption (yellow) for the United States, for example, was larger than its production (grey) for 2012, 18.55 mb/d (million barrels per day) compared to 8.9 mb/d, importing more than double its production to satisfy the gap in internal demand. Other nations with oil consumption higher that oil production include China, Brazil, Australia, India, UK, and Indonesia.

In contrast, oil consumption for Saudi Arabia for 2012 is estimated at 2.94 mb/d, while its production reached 11.53 md/d, exporting its oil surplus to the rest of the world. Other nations whose oil production exceeds its oil consumption include Canada, Mexico, Venezuela, Norway, Russia, Kuwait, United Arab Emirates, and Qatar.

Source: Winston Smith Labs: Global Oil Production and Consumption since 1965 [Interactive Map/Graph]


World Production of Rare Earth Metals

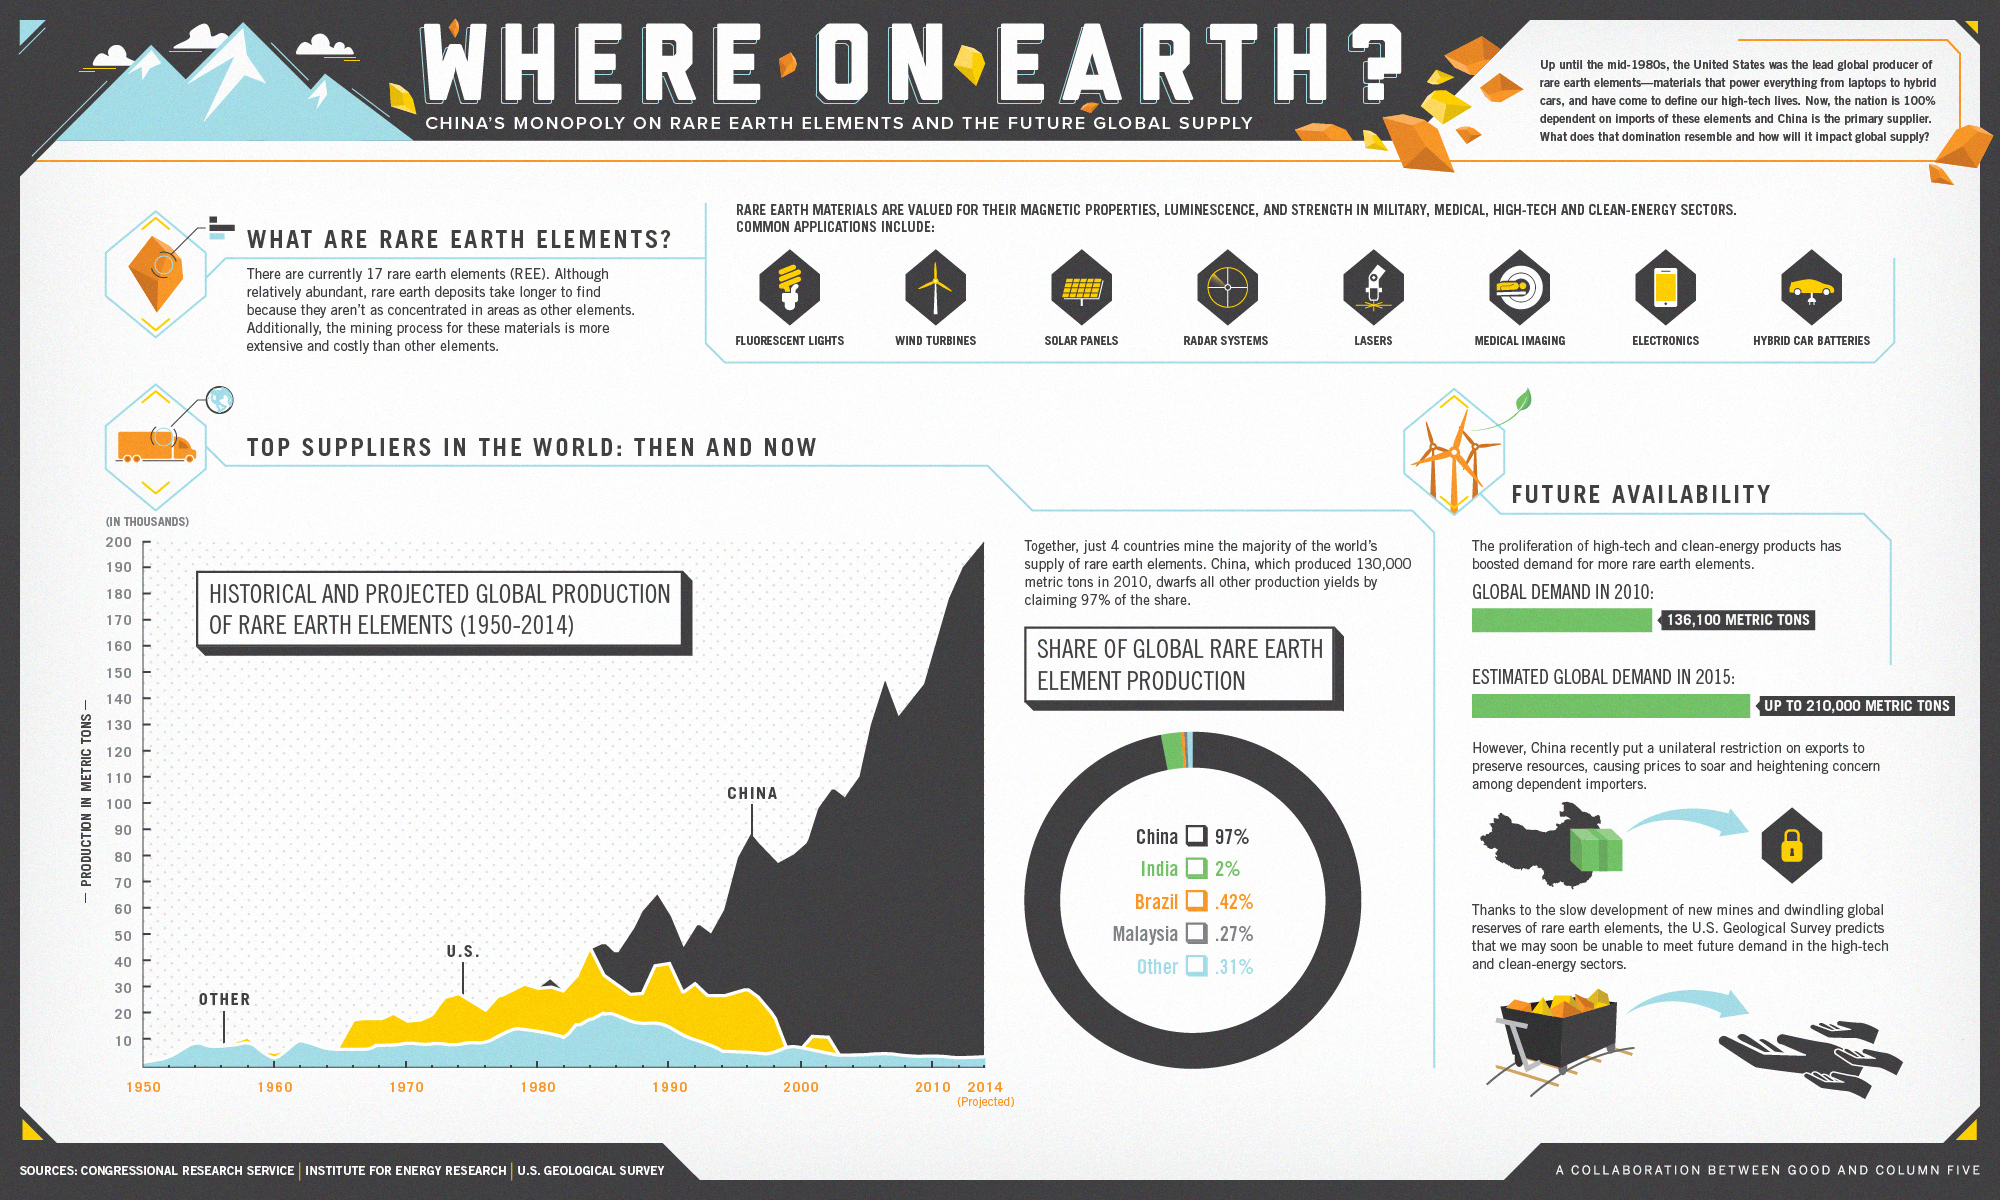
the future global supply of rare earth elementsRare earth metals or rare earth elements are a collection of seventeen chemical elements located at the bottom of the periodic table. They are key elements in the manufacture of high technology components, hybrid cars, solar panels, lasers, electronics, etc.

As of 2010, China produced 97% of the total world production of rare earths, or 130,000 metric tons, followed by India (2%), Brazil (0.42%), and Malaysia (0.27%).

The estimated demand for rare earths for 2015 will increase 54% compared to the demand in 2010.

Source: GOOD: Infographic: The Future Global Supply of Rare Earth Elements

See also: IndexMundi: Commodities Glossary – Rare Earth Metals


Key Commodities and Emerging Markets

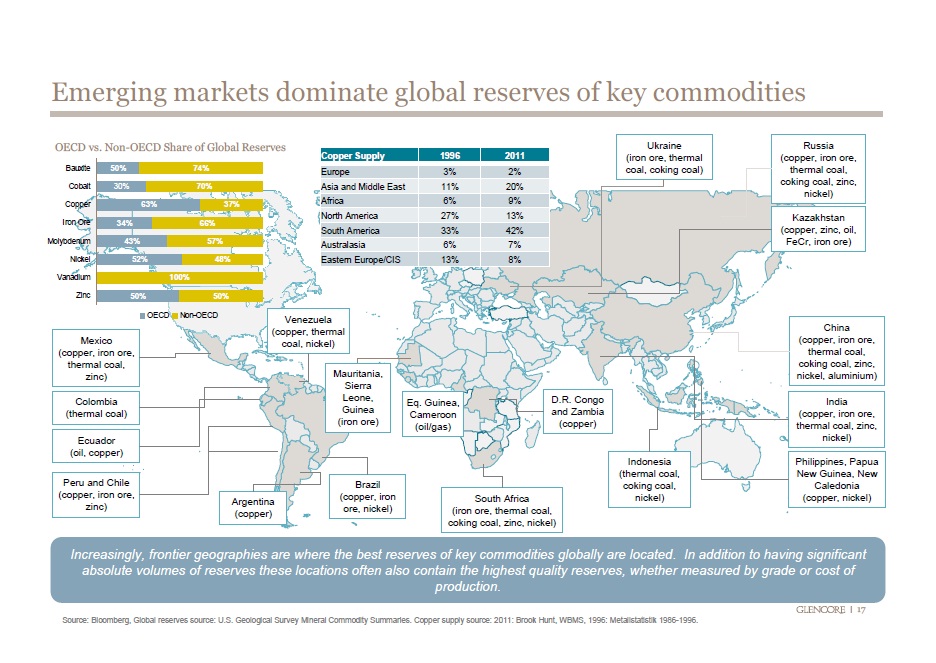
emerging market dominate commoditiesCommodities are raw materials essential for the production of more complex products. Commodities fall into three large categories: agricultural, energy, and metals.

According to this visualization, emerging economies (Brazil, Russia, India Indonesia, China, South Africa, etc.) have the largest reserves of certain key energy and metal commodities such as oil, coal, copper, cobalt, iron ore, molybdenum, nickel, zinc, and aluminum.

Source: Business Insider: 36 Maps That Explain The Entire World


Gasoline Spending by State in the U.S.

gas guzzlers mint finalMint.com tracked how much its users spend on gasoline in one month, and how many times they visit the pump in the same period across the United States.

On average, Americans spend $177 on gas in single month, making an average of 6 visits to the pump, and spending an average of $32 in each transaction.

San Jose (California) stands out as the city where Mint users spend the most on gas, an average of $216 in a single month. Other cities where Mint users spend a lot on gas include Birmingham (Alabama), Jacksonville (Florida), Phoenix (Arizona), and Charlotte (North Carolina) to name a few. In contrast, in cities like New York, Brooklyn (New York), and Washington D.C., which have a good public transportation system, the gas bill is between $102 and $112 per month.

Source: Mint: Gas Guzzlers