Monthly Archives: February 2007

United States Oil Imports

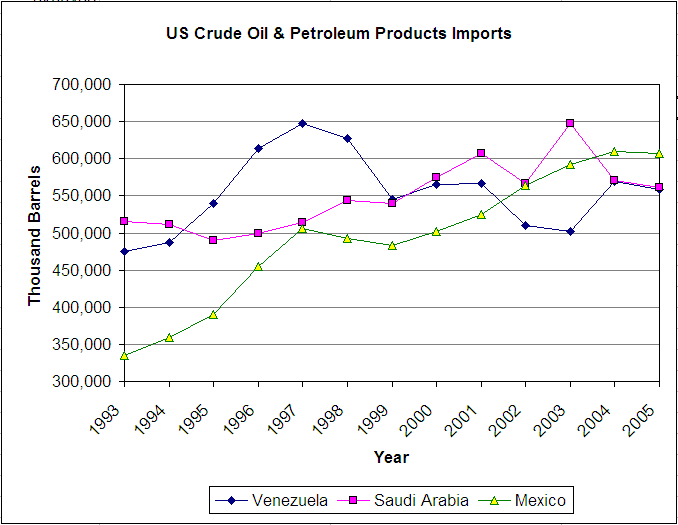
The US Energy Information Administration (EIA) has detailed data about US Crude Oil imports by country of origin. I used their data to create a chart showing US imports of crude oil and other petroleum products from 1993 to 2005. The chart shows that the top exporter of crude oil to the US is Mexico, followed by Saudi Arabia and Venezuela. If all goes well I will be adding similar charts to IndexMundi for easy visualization of oil & gas production, supply, and distribution data.

US Oil Imports by Country of Origin

Is your country going to meet its millennium development goals?

Now that the millennium development goals section is available, I can check whether any given country is likely to meet its goals. Taking Bolivia as an example, I can see that some indicators are changing in the right direction, but others are not. For instance, the percentage of the population who consume less than one US dollar (purchasing power parity), changed from 20.4% to 14.4% between 1997 and 1999, a clear improvement. However, between 1999 and 2002 the percentage increased from 14.2% to 23.2%, a marked worsening. I’m assuming that the 1991 number (5.7%) is incorrect since it’s so much lower than subsequent measurements. If it were correct, it would mean that the 1990s was a completely lost decade.

I’m working on making it easier to keep track of these types of changes. I’ll probably add a scorecard-type of interface that will display all indicators graphically.

Millennium Development Goals

I have just finished creating the millennium development goals section for 224 countries. Although this information is available elsewhere, what makes our release unique is that I have pre-computed for each indicator the percent change from one year to the next, and also the cumulative percent change since the first measurement. I will soon be adding graphs and the ability to compare countries. Stay tuned.