Category Archives: Energy

China at the Top of Renewable Energy Investment

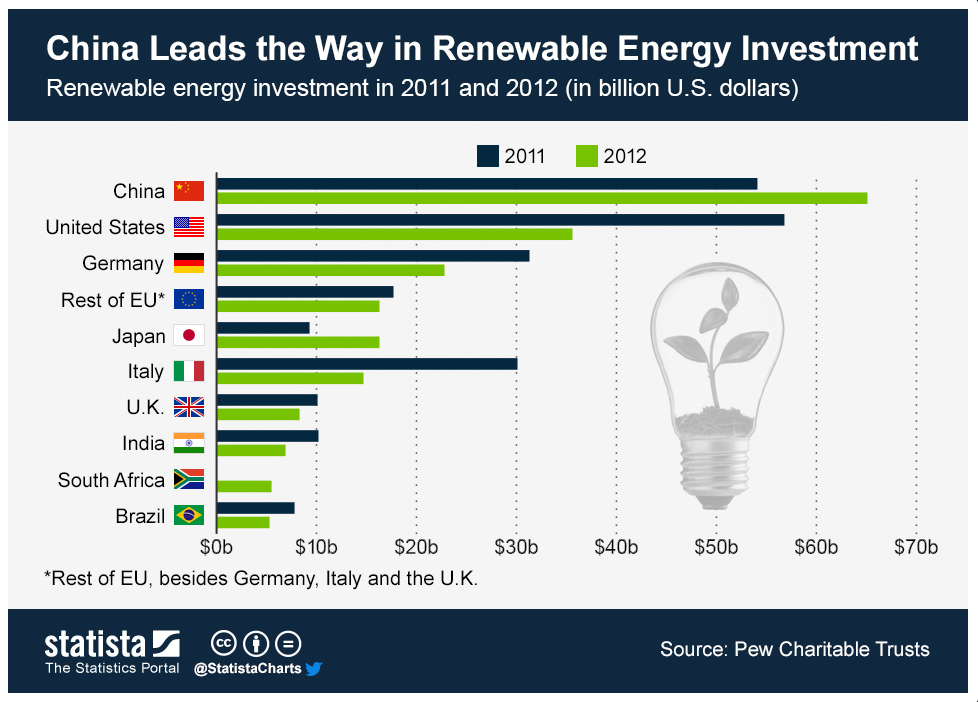
china leads energy investmentIn 2012 China’s investment in renewable energy surpassed the investment by the United States for the previous year and for the same year. In fact, China’s is ahead every other nation including Germany, Japan, and Italy.

China’s investment in renewable energy exceeded $60 billion for 2012, compared to an estimated $36 billion in the United States, and $23 billion in Germany for the same year.

Source: Statista: China Leads the Way in Renewable Energy Investment


Oil Production and Consumption by Country

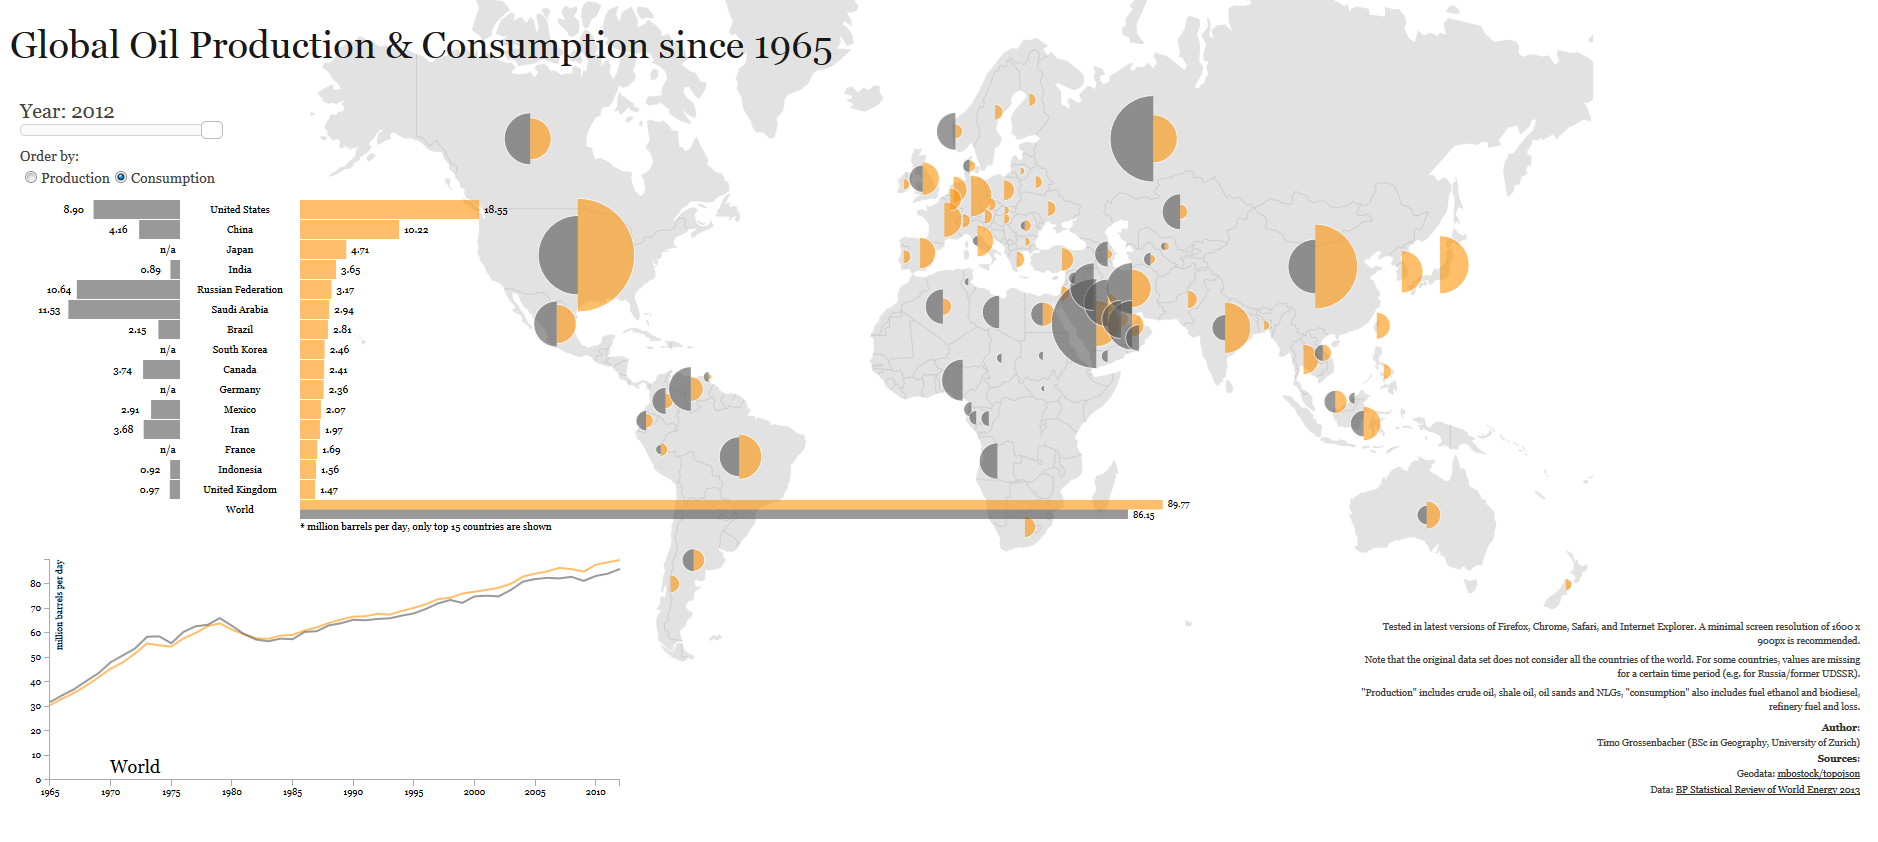
oil production and consumption since 1965When it comes to oil production and consumption, countries have a very close relationship of interdependence with each other. Some countries consume more oil than what they produce relying on imports to satisfy their internal demand. Others, consume less than what they produce, being able to export oil to nations that need it.

Oil consumption (yellow) for the United States, for example, was larger than its production (grey) for 2012, 18.55 mb/d (million barrels per day) compared to 8.9 mb/d, importing more than double its production to satisfy the gap in internal demand. Other nations with oil consumption higher that oil production include China, Brazil, Australia, India, UK, and Indonesia.

In contrast, oil consumption for Saudi Arabia for 2012 is estimated at 2.94 mb/d, while its production reached 11.53 md/d, exporting its oil surplus to the rest of the world. Other nations whose oil production exceeds its oil consumption include Canada, Mexico, Venezuela, Norway, Russia, Kuwait, United Arab Emirates, and Qatar.

Source: Winston Smith Labs: Global Oil Production and Consumption since 1965 [Interactive Map/Graph]
 

Global Carbon Footprint by Country

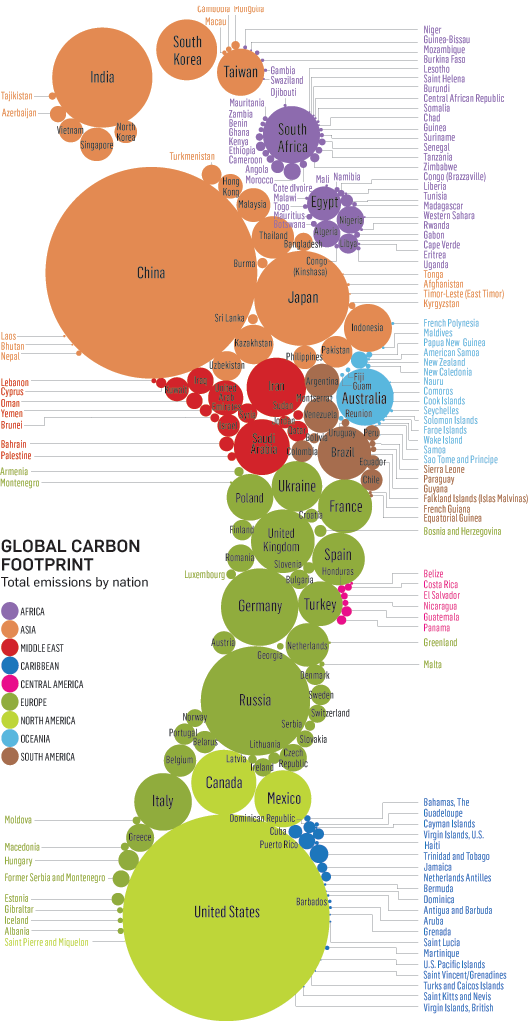
carbon footprint by countryThis original visualization by Stanford Kay shows total carbon emissions by country. Using different colors to differentiate each region, the size of the circle depicts the carbon footprint of each country.

Countries with the largest carbon footprint include China, United States, Russia, India, Japan, Germany, South Korea, Australia, UK, Iran, Saudi Arabia, Brazil, Taiwan, Ukraine, France, and Spain.


World Production of Rare Earth Metals

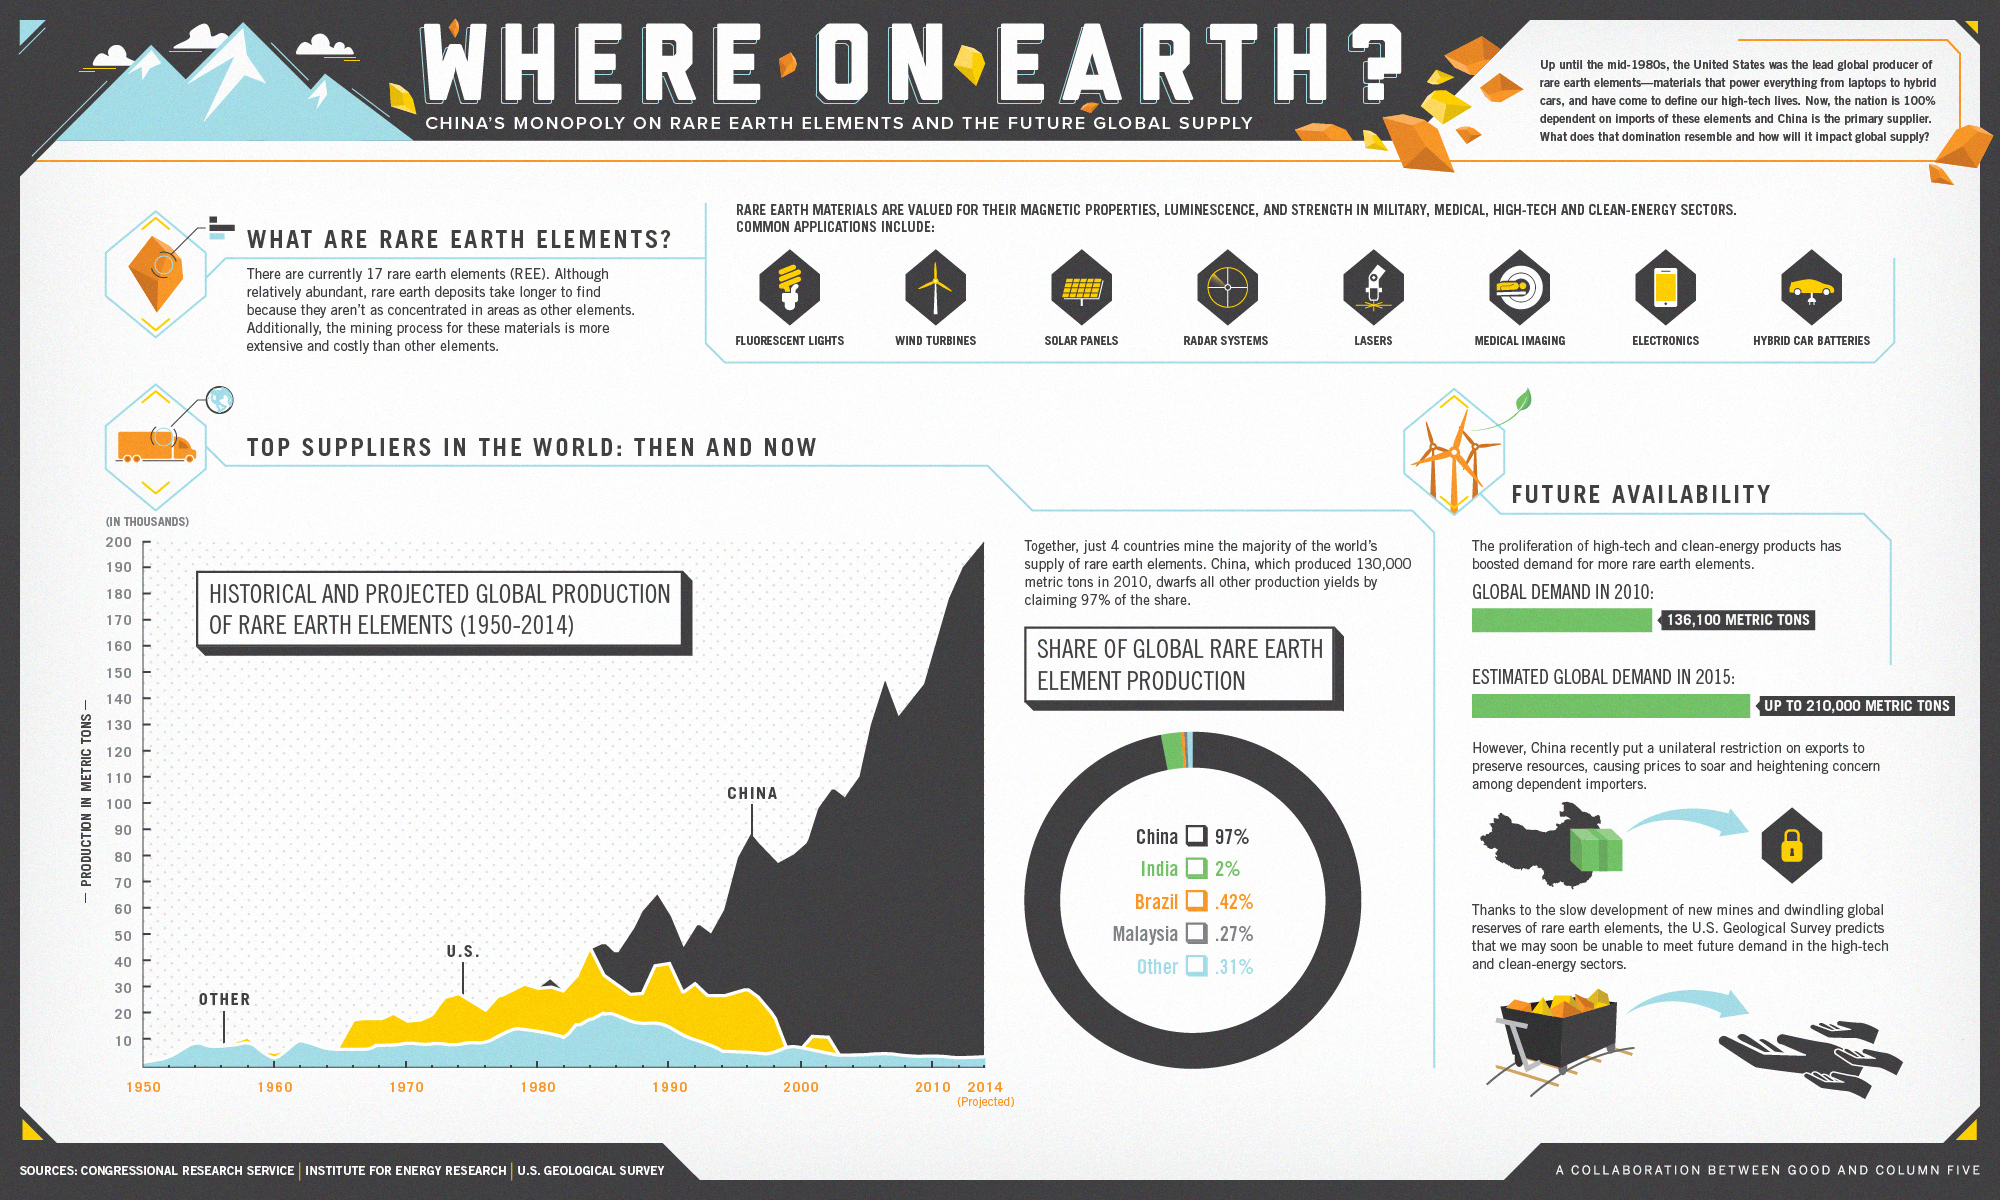
the future global supply of rare earth elementsRare earth metals or rare earth elements are a collection of seventeen chemical elements located at the bottom of the periodic table. They are key elements in the manufacture of high technology components, hybrid cars, solar panels, lasers, electronics, etc.

As of 2010, China produced 97% of the total world production of rare earths, or 130,000 metric tons, followed by India (2%), Brazil (0.42%), and Malaysia (0.27%).

The estimated demand for rare earths for 2015 will increase 54% compared to the demand in 2010.

Source: GOOD: Infographic: The Future Global Supply of Rare Earth Elements

See also: IndexMundi: Commodities Glossary – Rare Earth Metals


Key Commodities and Emerging Markets

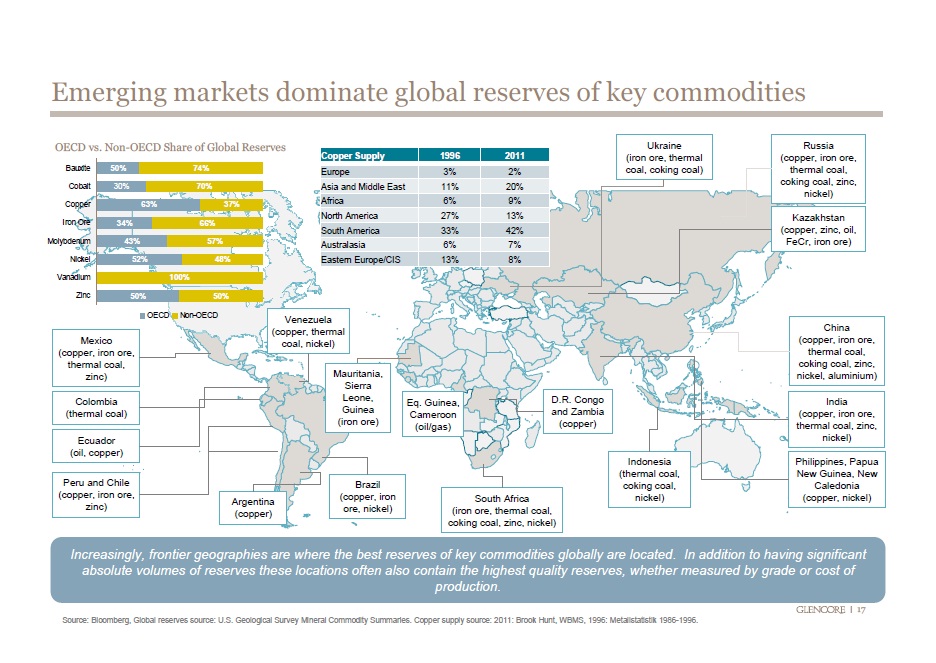
emerging market dominate commoditiesCommodities are raw materials essential for the production of more complex products. Commodities fall into three large categories: agricultural, energy, and metals.

According to this visualization, emerging economies (Brazil, Russia, India Indonesia, China, South Africa, etc.) have the largest reserves of certain key energy and metal commodities such as oil, coal, copper, cobalt, iron ore, molybdenum, nickel, zinc, and aluminum.

Source: Business Insider: 36 Maps That Explain The Entire World


Gasoline Spending by State in the U.S.

gas guzzlers mint finalMint.com tracked how much its users spend on gasoline in one month, and how many times they visit the pump in the same period across the United States.

On average, Americans spend $177 on gas in single month, making an average of 6 visits to the pump, and spending an average of $32 in each transaction.

San Jose (California) stands out as the city where Mint users spend the most on gas, an average of $216 in a single month. Other cities where Mint users spend a lot on gas include Birmingham (Alabama), Jacksonville (Florida), Phoenix (Arizona), and Charlotte (North Carolina) to name a few. In contrast, in cities like New York, Brooklyn (New York), and Washington D.C., which have a good public transportation system, the gas bill is between $102 and $112 per month.

Source: Mint: Gas Guzzlers


The World’s Largest Oil Reserves by Country

strategic oil reserves worldOil reserves are the amount of oil that can be technically and economically recovered from the ground.

Nations with the world’s largest oil reserves include Saudi Arabia, Venezuela, Iran, Iraq, Kuwait, United Arab Emirates, Russia, and Libya. Saudi Arabia, holds an approximate 234.5 billion barrels of oil reserves, and it has the largest market share for oil production after Russia. Saudi Arabia is followed by Venezuela, with an estimated 211.0 billion barrels of oil reserves, although its current oil production market share is only 3.2%.

By comparison, the United States has an estimated 30.9 billion barrels in oil reserves, and  8.7% market share in oil production.

Source: Spiegel Online: A World without Oil: Companies Prepare for a Fossil-Free Future


Crude Oil Exports and Imports by Country

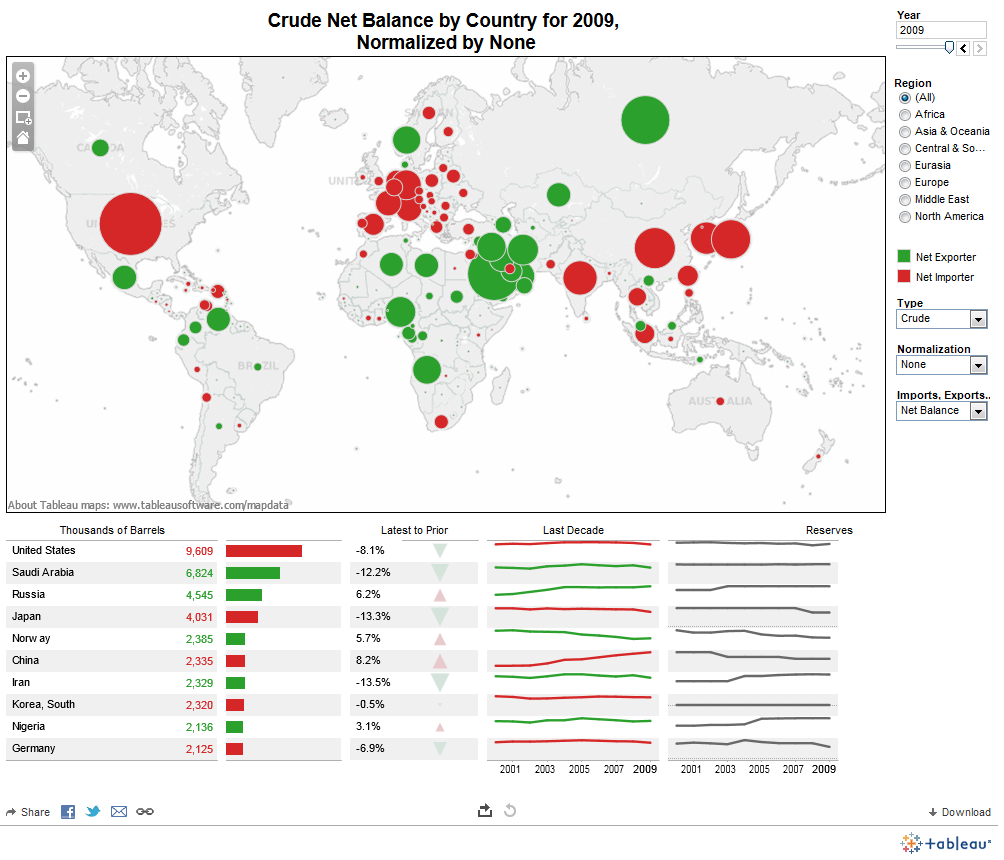
crude net balance by countryVast quantities of crude oil are exported and imported each year. Some countries are net exporters (their oil exports are larger than their oil imports), and some are net importers (their oil imports are larger than their exports).

In this visualization by Data Driven Consulting, we can see that the United States was the largest net importer of crude oil in 2009. Other net importer countries include China, India, Japan, South Korea, Germany, Belgium, Italy, UK, Spain, Singapore, and Australia.

Among the net exporters of crude oil we find Russia, Saudi Arabia, Iran, Iraq, Norway, Venezuela, Mexico, and Canada.

For the full-size interactive dashboard, visit: Tableau Public: Exporters and Importers


Gasoline Prices in Europe by Country

According to Russian news agency Ria Novosti, Norway has the highest gasoline price among European countries, with a price of 1.90 Euro per liter ( or US $9.475 per gallon at the current exchange rate of 1 Euro = US $1.31). Norway is followed by Italy, Netherlands, Sweden, and Greece.

The lowest gasoline prices are found in Belarus and Kazakhstan, 0.68 Euros and 0.70 Euros per liter, respectively. The average gasoline price for European nations is 1.39 Euros per liter.


Total Carbon Emissions by Country

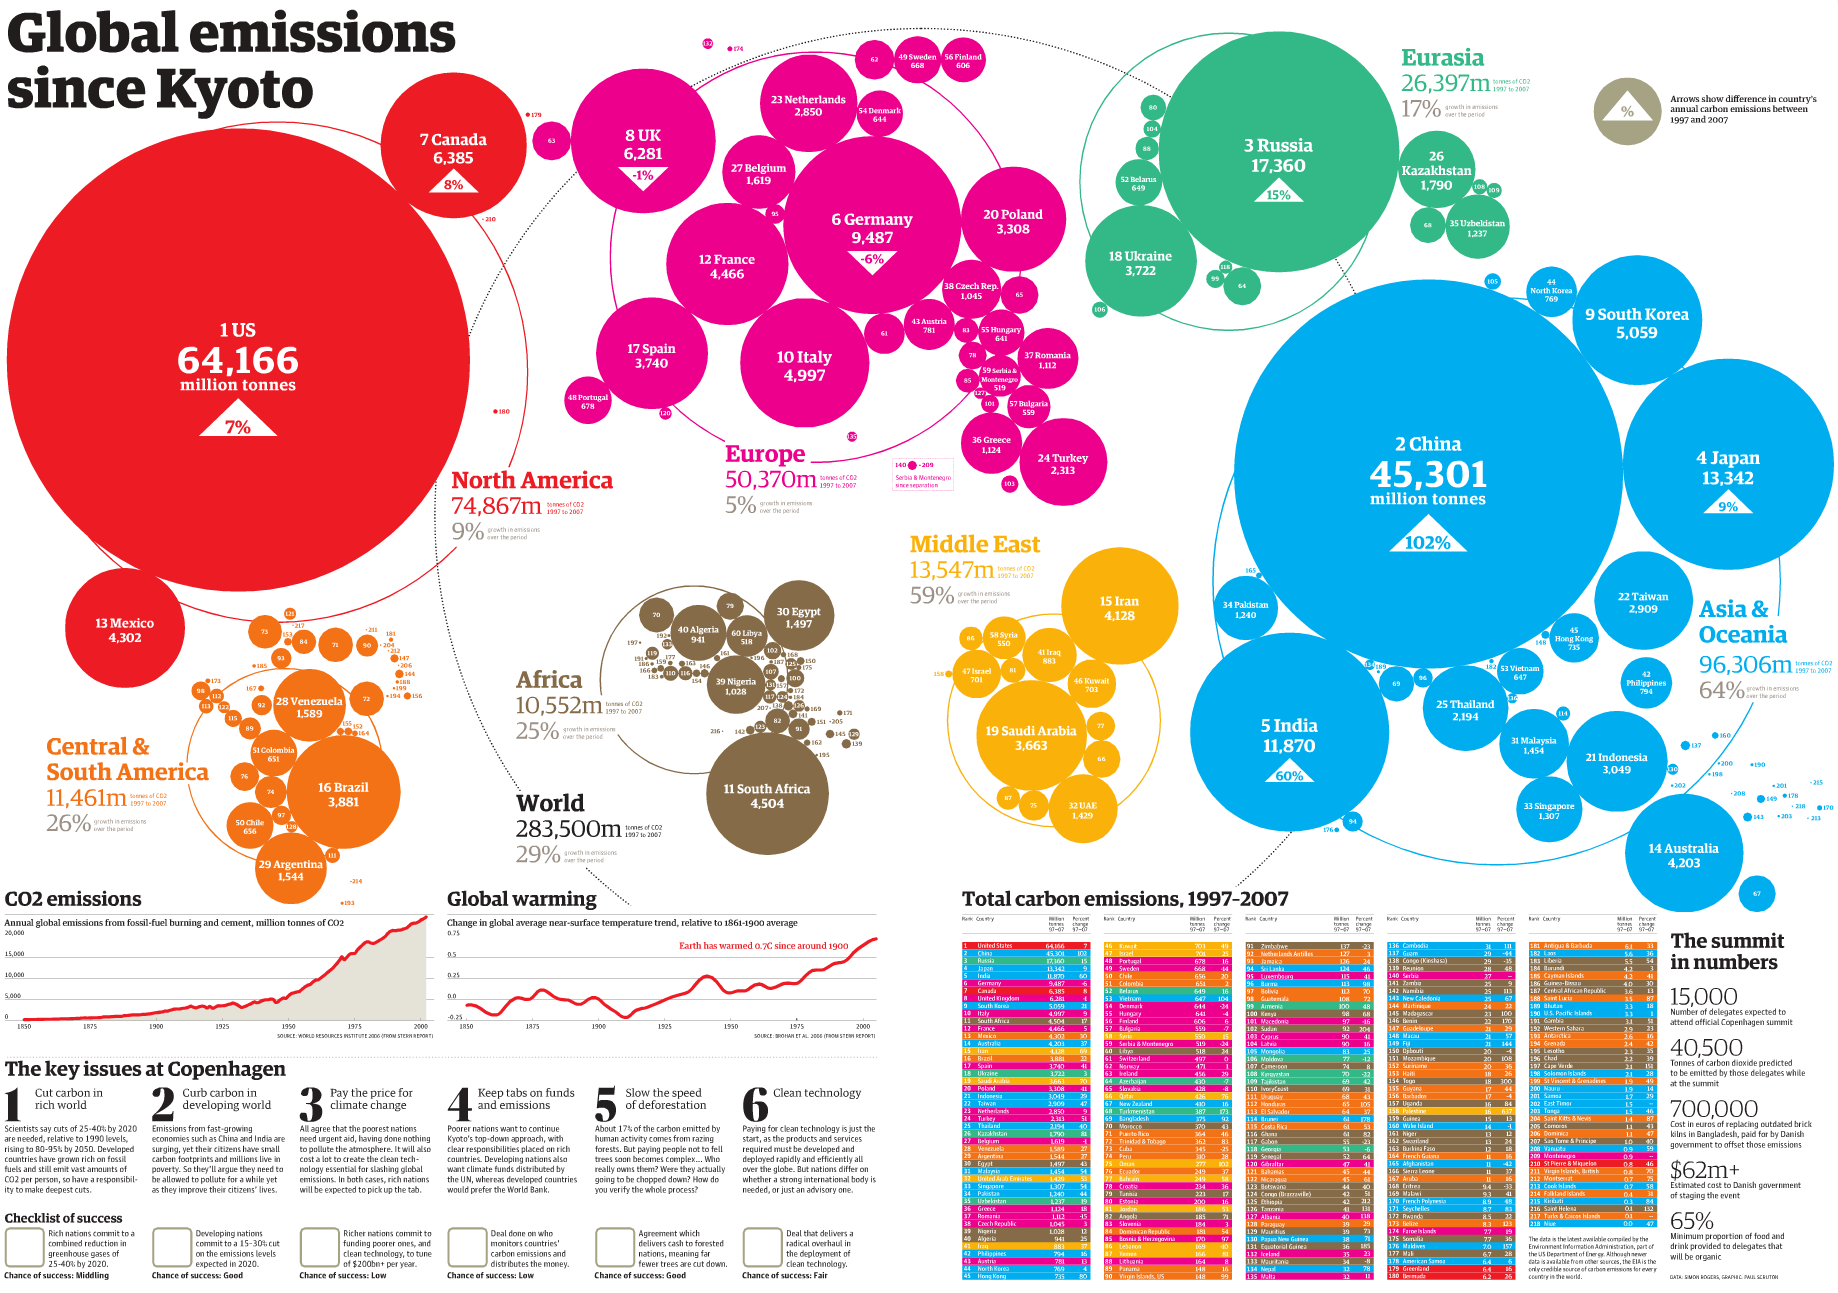
The Kyoto Protocol is an international treaty that seeks the reduction of greenhouse gases that contribute to global warming by setting emission reduction targets for industrialized nations. The Kyoto Protocol was signed on December 11, 1997 in Kyoto (Japan) by 191 countries. The United Stated signed the treaty, but later it did not ratify it.

This visualization by The Guardian shows total carbon emissions by country between 1997 and 2007, ten years since the protocol was signed.

The United States is the country that has produced the largest amount of carbon emissions (64,166 million tonnes) in the period 1997-2007 followed by China, Russia, Japan, India, and Germany.

Asia and Oceania combined are the regions with the highest carbon emissions produced in the same period (96,306 million tonnes). Asia and Oceania are followed by North America (U.S., Canada, and Mexico) with carbon emissions of the order of 74,867 million tonnes, and Europe with carbon emissions at 50,370 million tonnes as of 2007.