Category Archives: Energy

Internet Connectivity in the United States

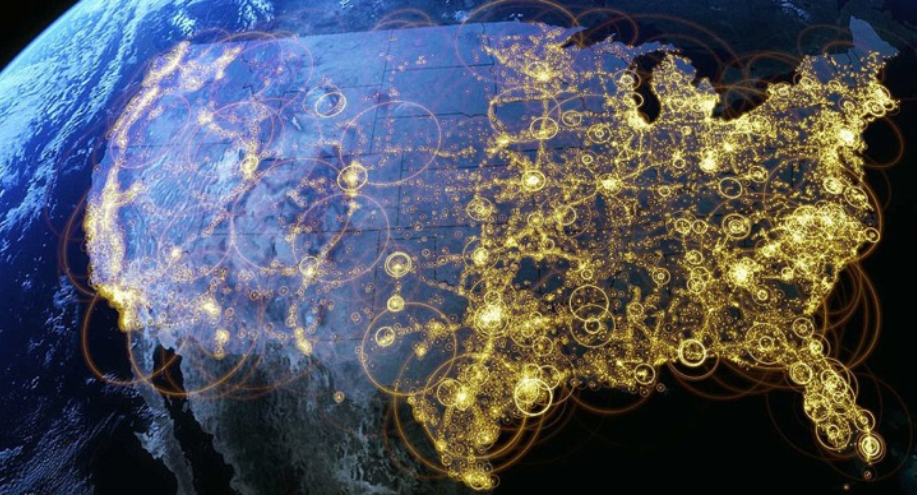
As part of the PBS series America Revealed, this aerial visualization shows the patterns of internet distribution in the United States. We can see that the regions with highest levels of internet connectivity include the Northeast, and parts of the South and Midwest, followed by the Pacific West.

For additional interesting aerial visualizations, such as the distribution of the unemployed, electricity network routes, public transportation paths, U.S. imports and exports of beef patterns, the distribution of the population in towns and cities, etc., visit: The Roosevelt’s – Aerial Data Visualisation Reveals Life In The United States.
Industrial Water Consumption by Country

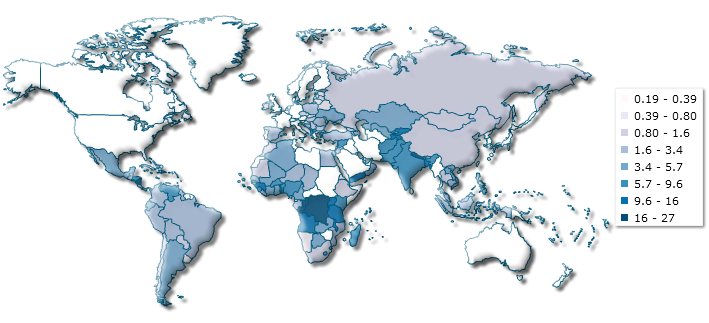
Across the globe, freshwater is consumed by four different economic sectors: domestic, industry, energy and agriculture. The agricultural sector is the largest consumer of water. The industrial and energy sectors follow suit, using 20% of available water resources.

This map (above), published by the Sustainable Sanitation and Water Management Toolbox, shows how much water is used by the industrial sector by each country. For the year 2009, the largest consumers of water for industrial use were the U.S. and Europe. Water consumption by the industrial sector accounted for 50% of total water use.


Fossil Fuel Subsidies Globally

Fossil fuel subsidies are very common in developing nations. Subsidies cover the difference between the price at which fossil fuels are sold inside the country and their actual price in international markets, creating a huge fiscal burden (an estimated $400 billion annually) for the countries that provide them. Developing nations with fossil fuel subsidies include: Venezuela, Argentina, Ecuador, Algeria, Libya, Egypt, Kuwait, Iran, Pakistan, Russia, China, India, Indonesia, etc.

Developed nations also provide subsidies in the form of tax breaks to the oil industry and other measures (estimated at a cost of $45 to $75 billion per year). Nations in this group include many OECD (Organization for Economic Co-operation and Development) members.

For the interactive map, visit: National Geographic: The Great Energy Challenge: Fossil Fuel Burden on State Coffers


The Cheapest and Most Expensive Places to Fill Your Gas Tank

click to enlarge

Gas prices go up or down according to supply-demand forces and to movements in the commodities market. According to this map, published by the Car and Driver blog, prices in the United States ($3.85 per gallon) are not that bad compared to gas prices in other countries.

European nations have the highest gas prices, above $7 per gallon. If you were in Turkey you will have to pay the highest price, a steep $9.39 per gallon. Turkey’s gas prices are followed by Norway ($9.38), Italy ( $9.00), Sweden ($8.75), the United Kingdom ($8.46), Germany ($8.29), and Iceland ($8.01).

In the Americas, the highest gas prices can be found in Belize ($7.59), followed by Uruguay ($6.99), Chile($6.60), Peru ($5.95), Argentina ($5.52) and Canada ($5.14). Gas prices are significantly low in Venezuela ($0.06) and Bolivia ($2.05) due to government subsidies.

Africa enjoys low gas prices, except for Djibouti ($6.48), Madagascar ($5.74), Zimbabwe ($5.38), and South Africa ($5.15).

In Asia, Japan pays the highest gas prices, $6.87 per gallon, followed by the Philippines ($5.43), and India ($5.42).

In Australia, New Zealand and Australia’s gas prices per gallon are $6.75 and $5.64, respectively.


California’s Skyrocketing Gas Prices

click to enlarge

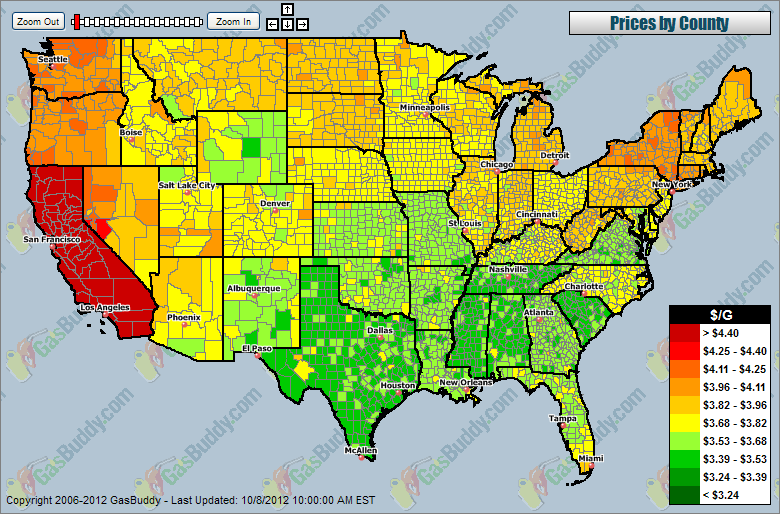
Gasoline prices in the U.S. have been rising lately, but for California the increase has been steeper. According to data of gas prices per county compiled by GasBuddy.com, prices in California are the highest in the U.S. California’s gas prices skyrocketed over the weekend due to supply disruption caused by a power outage to an Exxon Mobil plant in that state. As a result, regular gasoline reached an average record price of $4.614 per gallon.


How Many of Gallons of Gas Can You Purchase With Your Weekly Income?

Click to enlarge

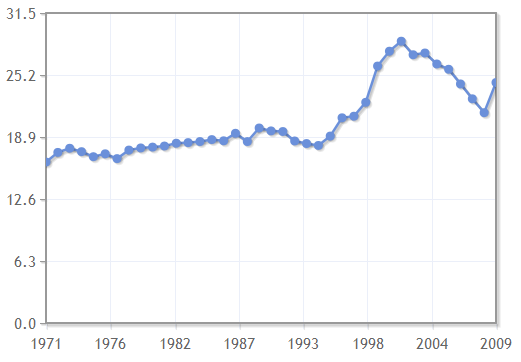
The average weekly income in the US has been going up in the last fifty years, at least in nominal terms, as seen in the first graph. The price of a gallon of gas has been trending up as well, with spikes beginning in 2002 up to 2008, when gas prices decreased dramatically as a consequence of the economic recession. In 2010 gas prices increased again and continue rising to this day, as seen in the second graph. It is worth noting that the number of gallons of gas that can be purchased by a person earning an average income has been decreasing steadily since 1998.