Category Archives: Topics

The 50 Largest Ports in the World

worlds 50 largest ports
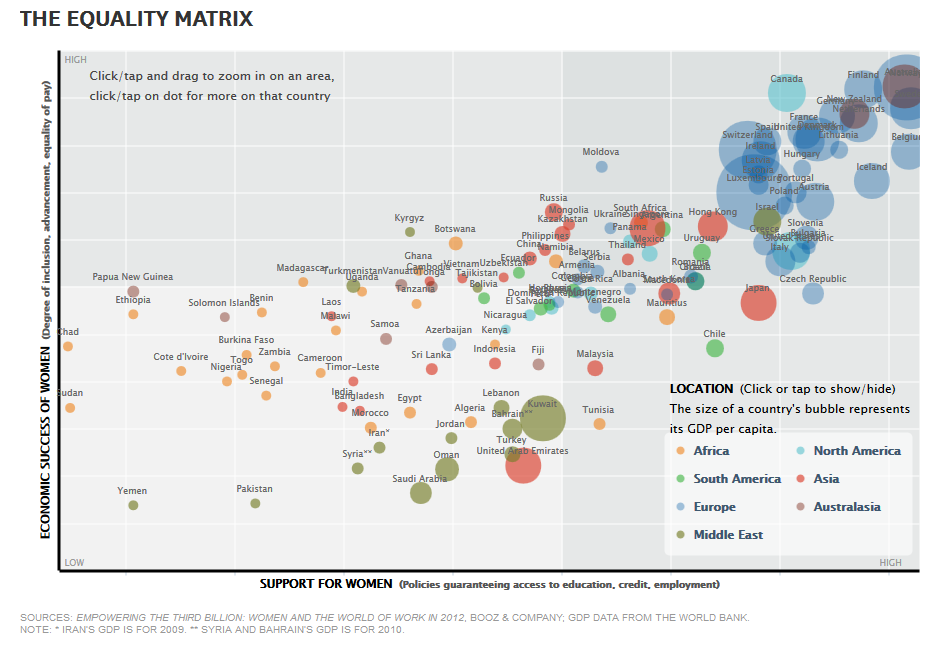
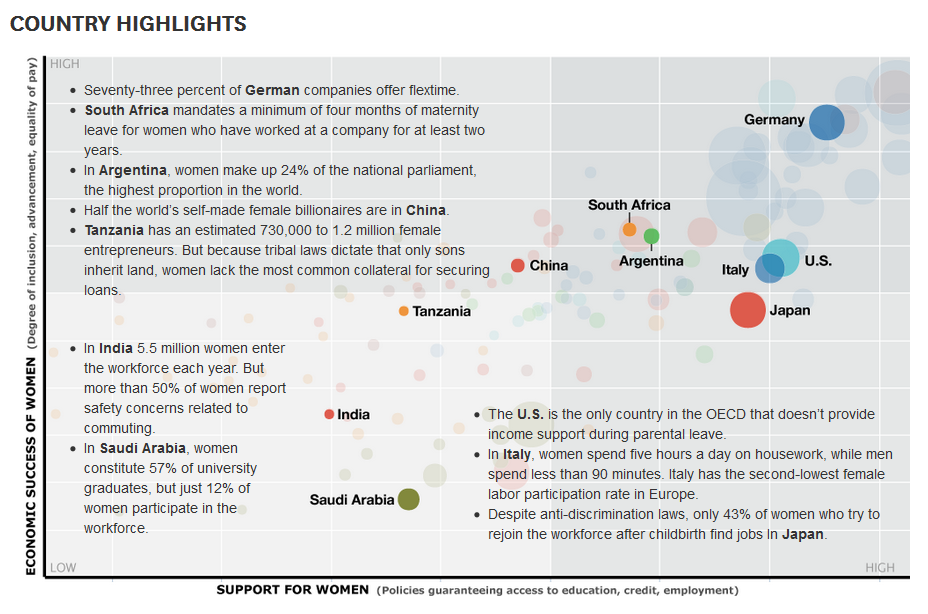
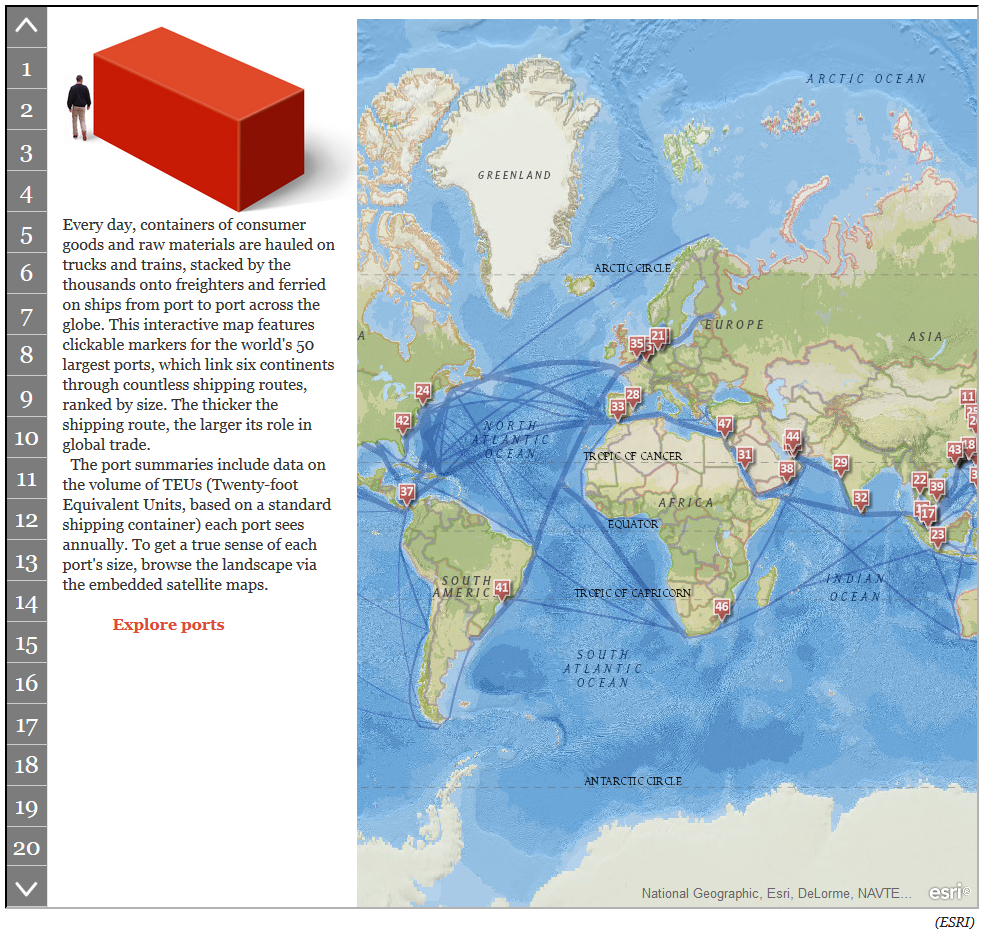
Every day finished goods and commodities are transported  by sea in shipping containers from one port to another across the globe. Standard shipping containers measure 20 feet long by eight feet wide, hence they receive the name of “Twenty-foot Equivalent Units” or TEUs.

The largest port in the world is in Shanghai (China) which saw a volume of 31.74 million TEUs of cargo freight passing through its port in 2011. Shanghai is followed by Singapore (Singapore) which saw a volume of 29.94 million TEUs passing through its port for the same year. Singapore is followed by Hong Kong, Shenzhen (China), Busan (South Korea), Ningbo, Guangzhou, and Qingdao (China), Dubai Ports (United Arab Emirates), and Rotterdam (Netherlands), all in the top ten.

For the interactive map, that allows you to explore each one of the largest 50 ports in the world, visit: The Smithsonian: Interactive: The 50 Largest Ports in the World


Percentage of the Population Living on $2 or Less a Day

surviving on a few dollars per day worldMIT economists Abhijit V. Banerjee and Esther Duflo, conducted surveys in developing nations to see which countries survive on a few dollars per day. The cities or countries where people are known to live on meager dollar amounts on a daily bases are not that surprising, but the percentage of the population living under these conditions is.

In Udaipur and Hyderabad (India) a staggering 94% of the population survive on $2 or less per day. In Bangladesh, 69.4% go on $2 or less per day. In Ghana, 67.7% survive on $2 or less per day. In Guatemala, 64.8% of the population survive on $2 or less per day.

Source: GOOD: Living on Less


The World’s Largest Oil Reserves by Country

strategic oil reserves worldOil reserves are the amount of oil that can be technically and economically recovered from the ground.

Nations with the world’s largest oil reserves include Saudi Arabia, Venezuela, Iran, Iraq, Kuwait, United Arab Emirates, Russia, and Libya. Saudi Arabia, holds an approximate 234.5 billion barrels of oil reserves, and it has the largest market share for oil production after Russia. Saudi Arabia is followed by Venezuela, with an estimated 211.0 billion barrels of oil reserves, although its current oil production market share is only 3.2%.

By comparison, the United States has an estimated 30.9 billion barrels in oil reserves, and  8.7% market share in oil production.

Source: Spiegel Online: A World without Oil: Companies Prepare for a Fossil-Free Future


Condom Imports by Country

One of our visitors asked us if we had statistics on condom imports so we started looking through our trade section and found the data somewhat hidden under the category “sheath contraceptives of vulcanised rubber”. Anyway, the graph below shows the top 25 countries ranked by the value of their condom imports. You may also want to check our data on condom exports. Are you surprised by the rankings?

Condom imports by country

Women in the Workforce by Country

women and equality worldIt has been said, that if women participated in the workforce more actively, like their male counterparts, the Gross Domestic Product (GDP) of those countries would be higher.

However, most countries, including some developed nations do not have policies in place that support women’s participation in the workforce, such as access to education, credit, employment, paid maternity leave or child care.

Countries with the highest economic success for women (measured in terms of equality of pay, degree of inclusion in the workforce, and career advancement), that offer the best policies for supporting women in the workforce include Norway, Australia, Sweden, Finland, Germany, Belgium, and Iceland.

Countries with the lowest degree of economic success that have few policies (or none) that support women in the workplace include Chad, Sudan, Yemen, Pakistan, Syria, Saudi Arabia, among others.

women and equality world 2Some interesting facts about the success of women in the workplace and the policies in place to support them in certain countries can be seen in the graphic above.

Source: Harvard Business Review: Vision Statement: Women and the Economics of Equality


Crude Oil Exports and Imports by Country

crude net balance by countryVast quantities of crude oil are exported and imported each year. Some countries are net exporters (their oil exports are larger than their oil imports), and some are net importers (their oil imports are larger than their exports).

In this visualization by Data Driven Consulting, we can see that the United States was the largest net importer of crude oil in 2009. Other net importer countries include China, India, Japan, South Korea, Germany, Belgium, Italy, UK, Spain, Singapore, and Australia.

Among the net exporters of crude oil we find Russia, Saudi Arabia, Iran, Iraq, Norway, Venezuela, Mexico, and Canada.

For the full-size interactive dashboard, visit: Tableau Public: Exporters and Importers


Gasoline Prices in Europe by Country

According to Russian news agency Ria Novosti, Norway has the highest gasoline price among European countries, with a price of 1.90 Euro per liter ( or US $9.475 per gallon at the current exchange rate of 1 Euro = US $1.31). Norway is followed by Italy, Netherlands, Sweden, and Greece.

The lowest gasoline prices are found in Belarus and Kazakhstan, 0.68 Euros and 0.70 Euros per liter, respectively. The average gasoline price for European nations is 1.39 Euros per liter.


Alcohol Consumption Per Capita by Country

Alcohol consumption per capita by country

According to the the World Health Organization (WHO), alcohol consumption by adults on a per-capita basis is highest primarily in Eastern Europe. The Global Status Status Report on Alcohol and Health ranks Moldova, Hungary, and Russia at the top of the list. In Moldova, adults consume 18.22 liters of alcohol per year through a combination of beer, wine and spirits. How much alcohol is consumed in your country?

Total Carbon Emissions by Country

The Kyoto Protocol is an international treaty that seeks the reduction of greenhouse gases that contribute to global warming by setting emission reduction targets for industrialized nations. The Kyoto Protocol was signed on December 11, 1997 in Kyoto (Japan) by 191 countries. The United Stated signed the treaty, but later it did not ratify it.

This visualization by The Guardian shows total carbon emissions by country between 1997 and 2007, ten years since the protocol was signed.

The United States is the country that has produced the largest amount of carbon emissions (64,166 million tonnes) in the period 1997-2007 followed by China, Russia, Japan, India, and Germany.

Asia and Oceania combined are the regions with the highest carbon emissions produced in the same period (96,306 million tonnes). Asia and Oceania are followed by North America (U.S., Canada, and Mexico) with carbon emissions of the order of 74,867 million tonnes, and Europe with carbon emissions at 50,370 million tonnes as of 2007.


World Internet Users by Region

Of the 7 billion people in the world, only 2.4 billion are connected to the Internet, that is roughly 34% of the population as of 2012.

Internet penetration is the highest in North America (79%), followed by Oceania (68%), Europe (63%), and Latin America (43%).

Source: Statista: Only a Third of the World’s Population Is Online