Tag Archives: Russia

Consumption of Spirits by Country

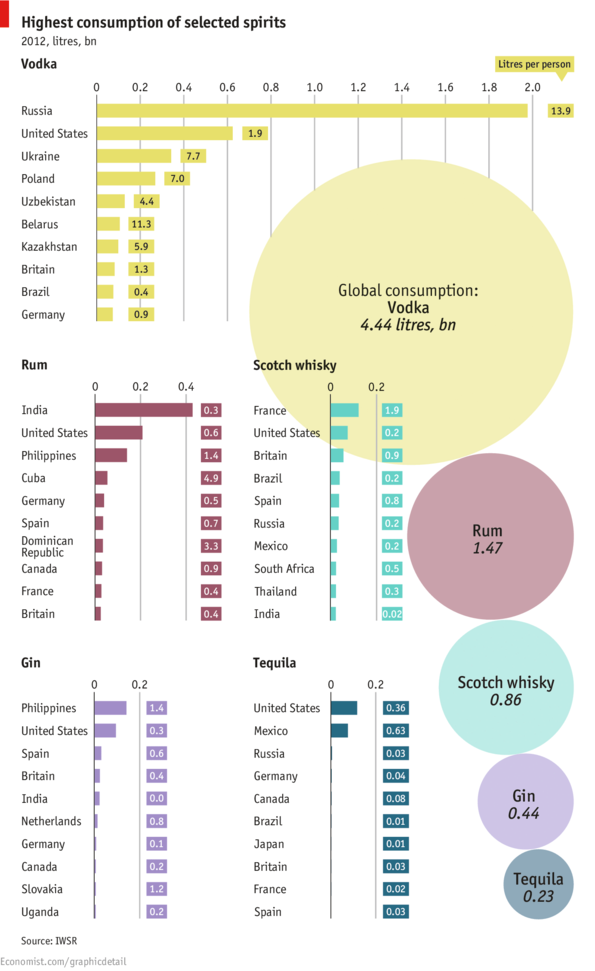
highest consumption of spiritsThe Economist compiled a visualization of the highest consumption of selected spirits worldwide. The selected spirits include vodka, rum, scotch whiskey, gin, and tequila.

The largest consumer of vodka is Russia, followed by the United States, Ukraine, Poland among others. The largest consumer of rum is India, followed by the United States, Philippines, and Cuba. The largest consumers of scotch whiskey, gin, and tequila are France, Philippines, and the United States respectively.


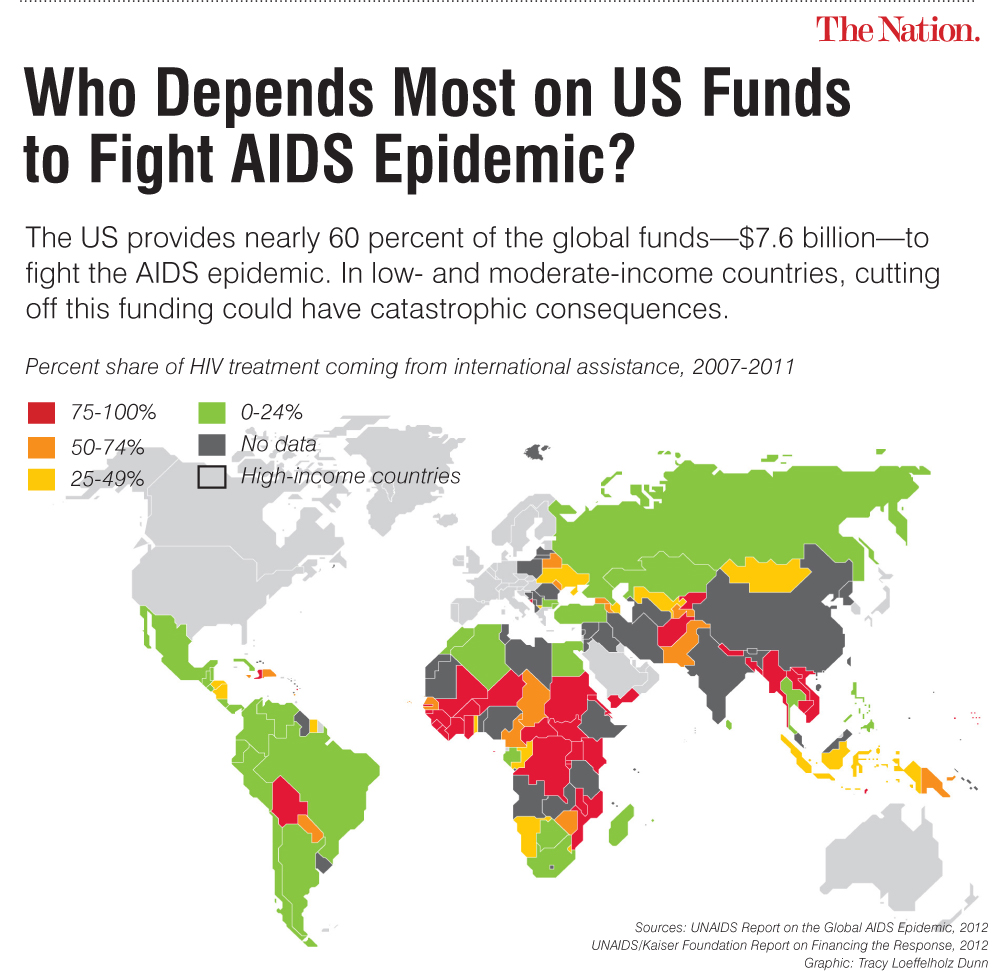
Dependency on U.S. Funds to Fight AIDS by Country

dependence on us funds for hivThe United States provides 60% of the funding to fight the AIDS epidemic worldwide. The highest recipients of this funding are African nations. Other countries include Bolivia, Yemen, Afghanistan, Kyrgyzstan, Nepal, Bangladesh, Burma, Cambodia, and Vietnam.

Latin America depends on these funds to fight AIDS too. Latin American nations are recipients of up to 24% of funding from the US along with Russia, Kazakhstan, Turkey, Bulgaria, Thailand, and Indonesia.

Source: The Nation: Who Depends Most on US Funds to Fight AIDS Epidemic


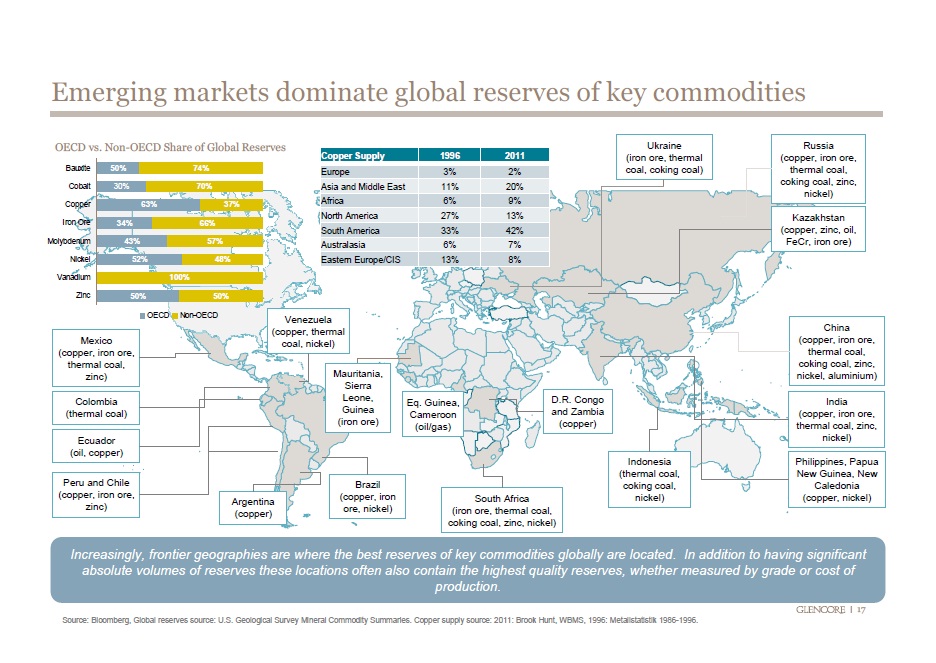
Key Commodities and Emerging Markets

emerging market dominate commoditiesCommodities are raw materials essential for the production of more complex products. Commodities fall into three large categories: agricultural, energy, and metals.

According to this visualization, emerging economies (Brazil, Russia, India Indonesia, China, South Africa, etc.) have the largest reserves of certain key energy and metal commodities such as oil, coal, copper, cobalt, iron ore, molybdenum, nickel, zinc, and aluminum.

Source: Business Insider: 36 Maps That Explain The Entire World


The World’s Largest Oil Reserves by Country

strategic oil reserves worldOil reserves are the amount of oil that can be technically and economically recovered from the ground.

Nations with the world’s largest oil reserves include Saudi Arabia, Venezuela, Iran, Iraq, Kuwait, United Arab Emirates, Russia, and Libya. Saudi Arabia, holds an approximate 234.5 billion barrels of oil reserves, and it has the largest market share for oil production after Russia. Saudi Arabia is followed by Venezuela, with an estimated 211.0 billion barrels of oil reserves, although its current oil production market share is only 3.2%.

By comparison, the United States has an estimated 30.9 billion barrels in oil reserves, and  8.7% market share in oil production.

Source: Spiegel Online: A World without Oil: Companies Prepare for a Fossil-Free Future


Drought Severity by Country (1901 – 2008)

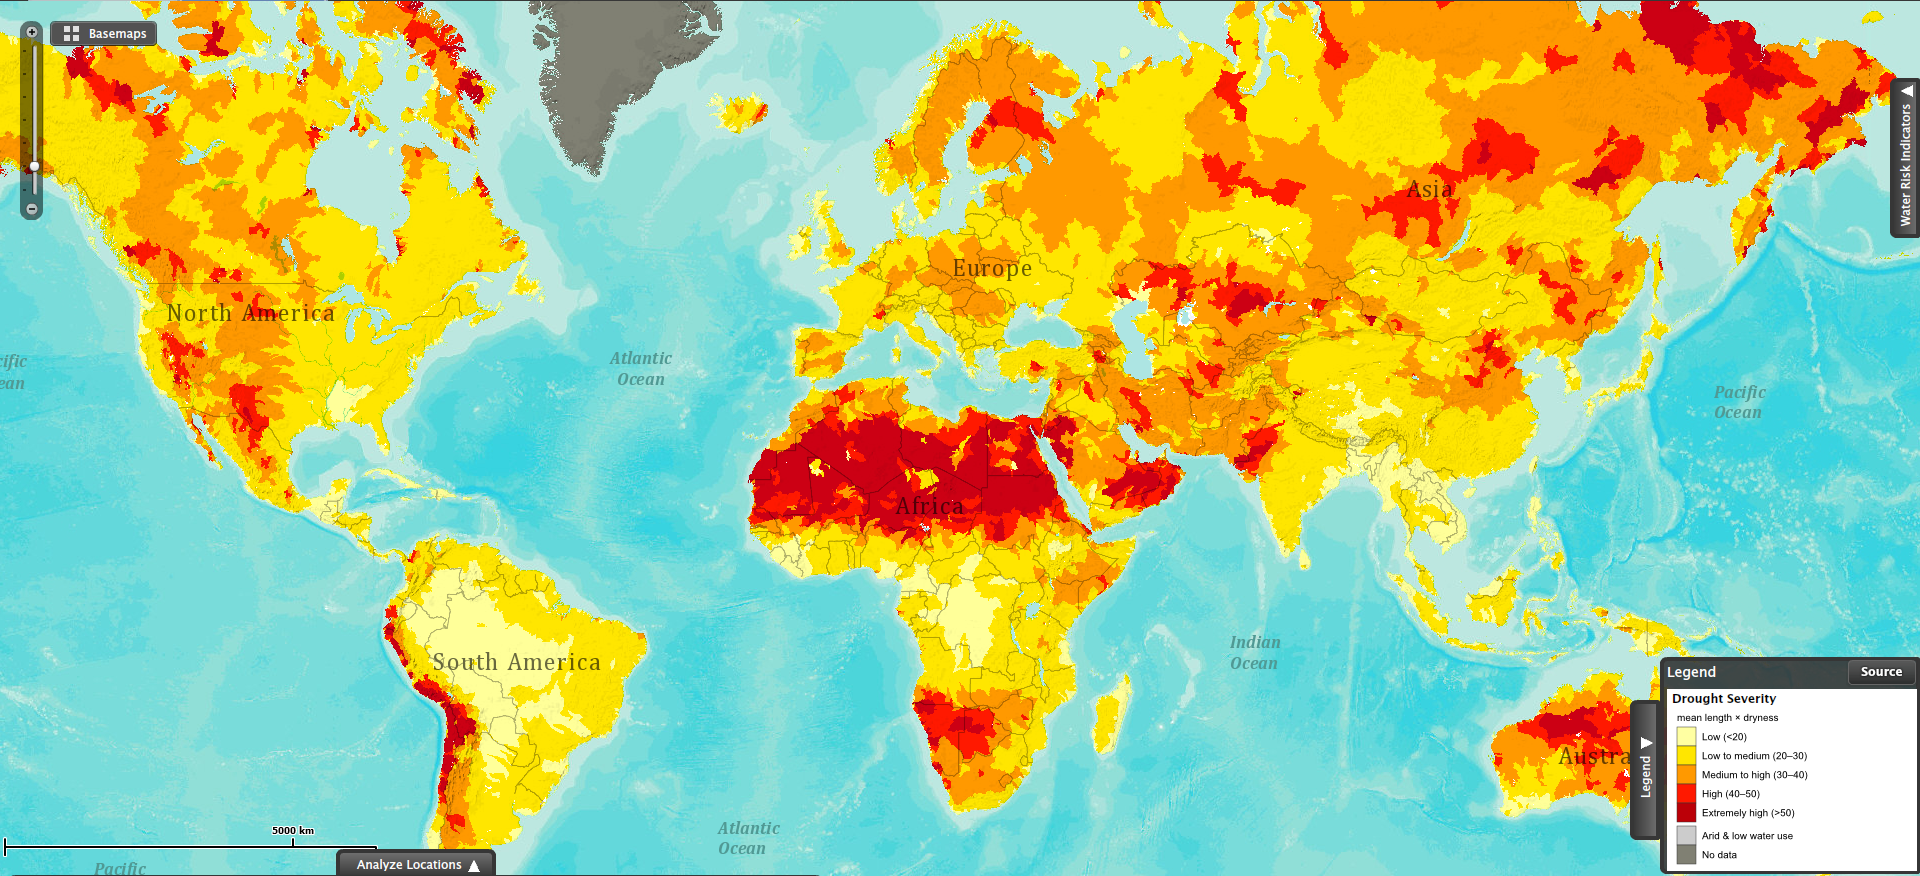
drought severity worldThis map shows drought severity, measured as the product of the average length of a drought occurrence and how dry it was the drought. This visualization is based on data collected for the period between 1901 and 2008.

The red areas in the map show the regions most severely affected by droughts. The northern region of the African continent stands out as the largest area being affected by severe droughts. Southwestern Africa (Namibia and Botswana) has also been severely affected by droughts in the same period.

Some areas in the Andean region in South America (Ecuador, Peru, Bolivia, Chile and Argentina) have also suffered the effects of severe droughts during the past century.

Parts of Australia and Russia have also been affected by extreme drought conditions.

Sources:


Crude Oil Exports and Imports by Country

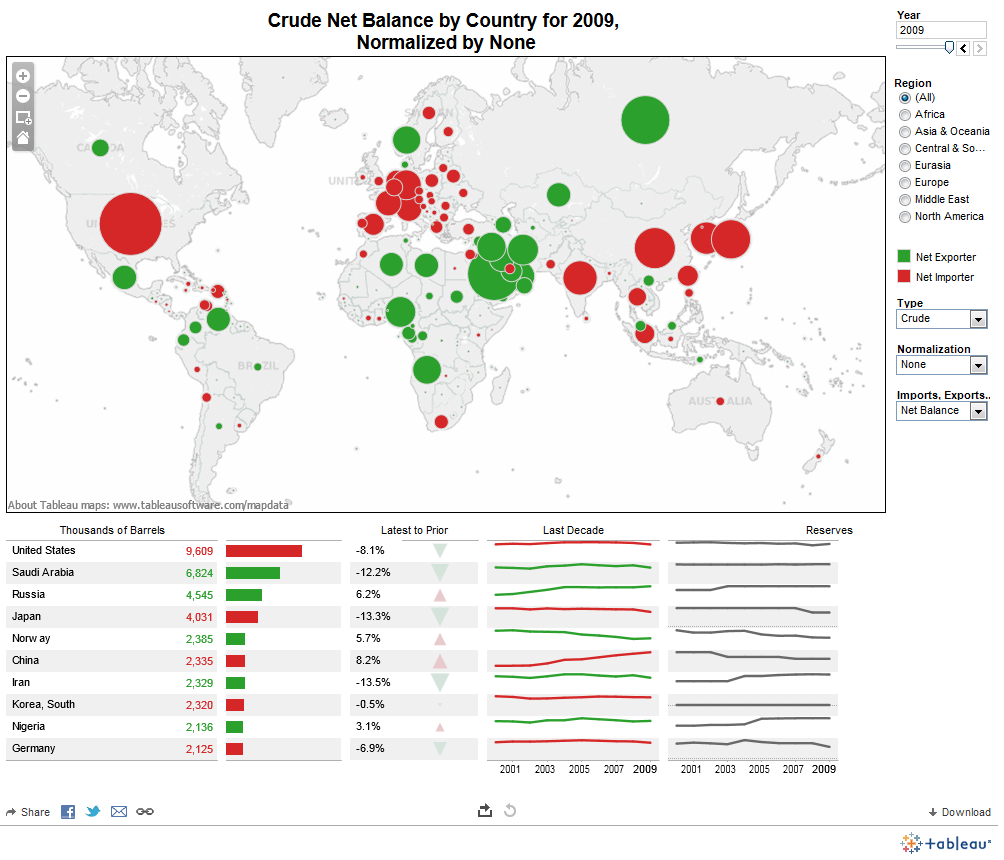
crude net balance by countryVast quantities of crude oil are exported and imported each year. Some countries are net exporters (their oil exports are larger than their oil imports), and some are net importers (their oil imports are larger than their exports).

In this visualization by Data Driven Consulting, we can see that the United States was the largest net importer of crude oil in 2009. Other net importer countries include China, India, Japan, South Korea, Germany, Belgium, Italy, UK, Spain, Singapore, and Australia.

Among the net exporters of crude oil we find Russia, Saudi Arabia, Iran, Iraq, Norway, Venezuela, Mexico, and Canada.

For the full-size interactive dashboard, visit: Tableau Public: Exporters and Importers


Gasoline Prices in Europe by Country

According to Russian news agency Ria Novosti, Norway has the highest gasoline price among European countries, with a price of 1.90 Euro per liter ( or US $9.475 per gallon at the current exchange rate of 1 Euro = US $1.31). Norway is followed by Italy, Netherlands, Sweden, and Greece.

The lowest gasoline prices are found in Belarus and Kazakhstan, 0.68 Euros and 0.70 Euros per liter, respectively. The average gasoline price for European nations is 1.39 Euros per liter.


Number of Nuclear Tests Since 1945

North Korea conducted its third nuclear test on February, 2013. Two nuclear test preceded this one, the first in 2006, and the second in 2009.

However, the nation that has performed the largest number of nuclear tests since 1945 is the United States, a total of 1,032. In the same period, the USSR/Russia performed a total of 715 nuclear tests, and France performed a total of 210 nuclear tests.

Source: Statista: North Korea Conducts Third Nuclear Test


Total Carbon Emissions by Country

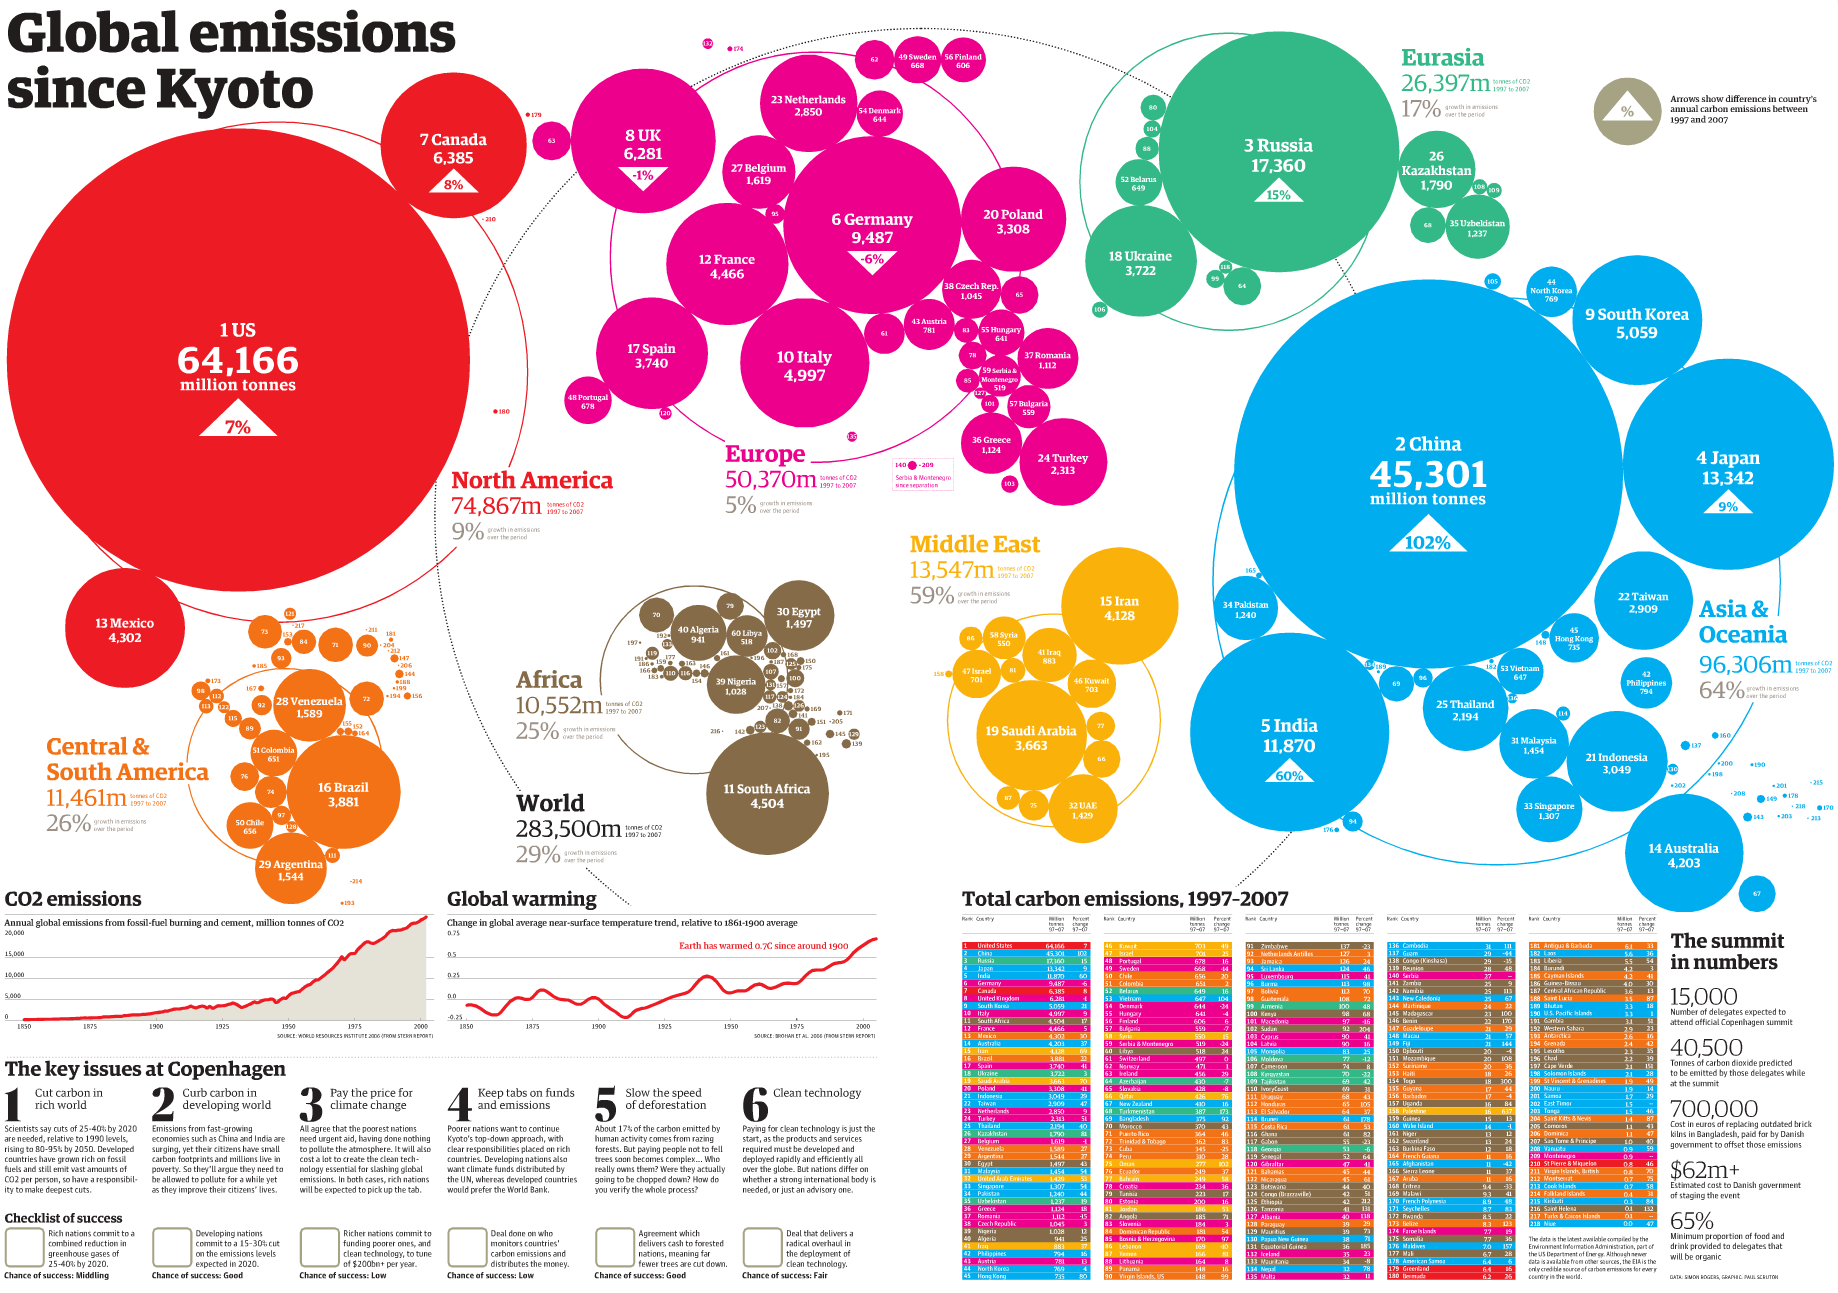
The Kyoto Protocol is an international treaty that seeks the reduction of greenhouse gases that contribute to global warming by setting emission reduction targets for industrialized nations. The Kyoto Protocol was signed on December 11, 1997 in Kyoto (Japan) by 191 countries. The United Stated signed the treaty, but later it did not ratify it.

This visualization by The Guardian shows total carbon emissions by country between 1997 and 2007, ten years since the protocol was signed.

The United States is the country that has produced the largest amount of carbon emissions (64,166 million tonnes) in the period 1997-2007 followed by China, Russia, Japan, India, and Germany.

Asia and Oceania combined are the regions with the highest carbon emissions produced in the same period (96,306 million tonnes). Asia and Oceania are followed by North America (U.S., Canada, and Mexico) with carbon emissions of the order of 74,867 million tonnes, and Europe with carbon emissions at 50,370 million tonnes as of 2007.
 

Billionaires and their Wealth by Country

This map of the world’s wealthiest citizens was created by Forbes. A total of 1,426 billionaires were found across the globe, worth $5.4 trillion combined.

The wealth of billionaires in the U.S. alone, 1,872.5 trillion, is larger than the combined wealth of billionaires in each continent. The wealth of the world’s richest in the Americas is an outstanding $2.4 trillion thanks to the contributions of billionaires mainly from the U.S., Brazil, Mexico, Canada, Chile, Colombia, Peru, and Venezuela.

The Americas are followed by Europe, where the wealth of its billionaires combined is valued at $1.55 trillion. Europe is followed by Asia with the wealth of its billionaires estimated at $1.16 trillion. Africa and the Middle East come at last, where the total net worth of its richest citizens is valued at $279 billion.