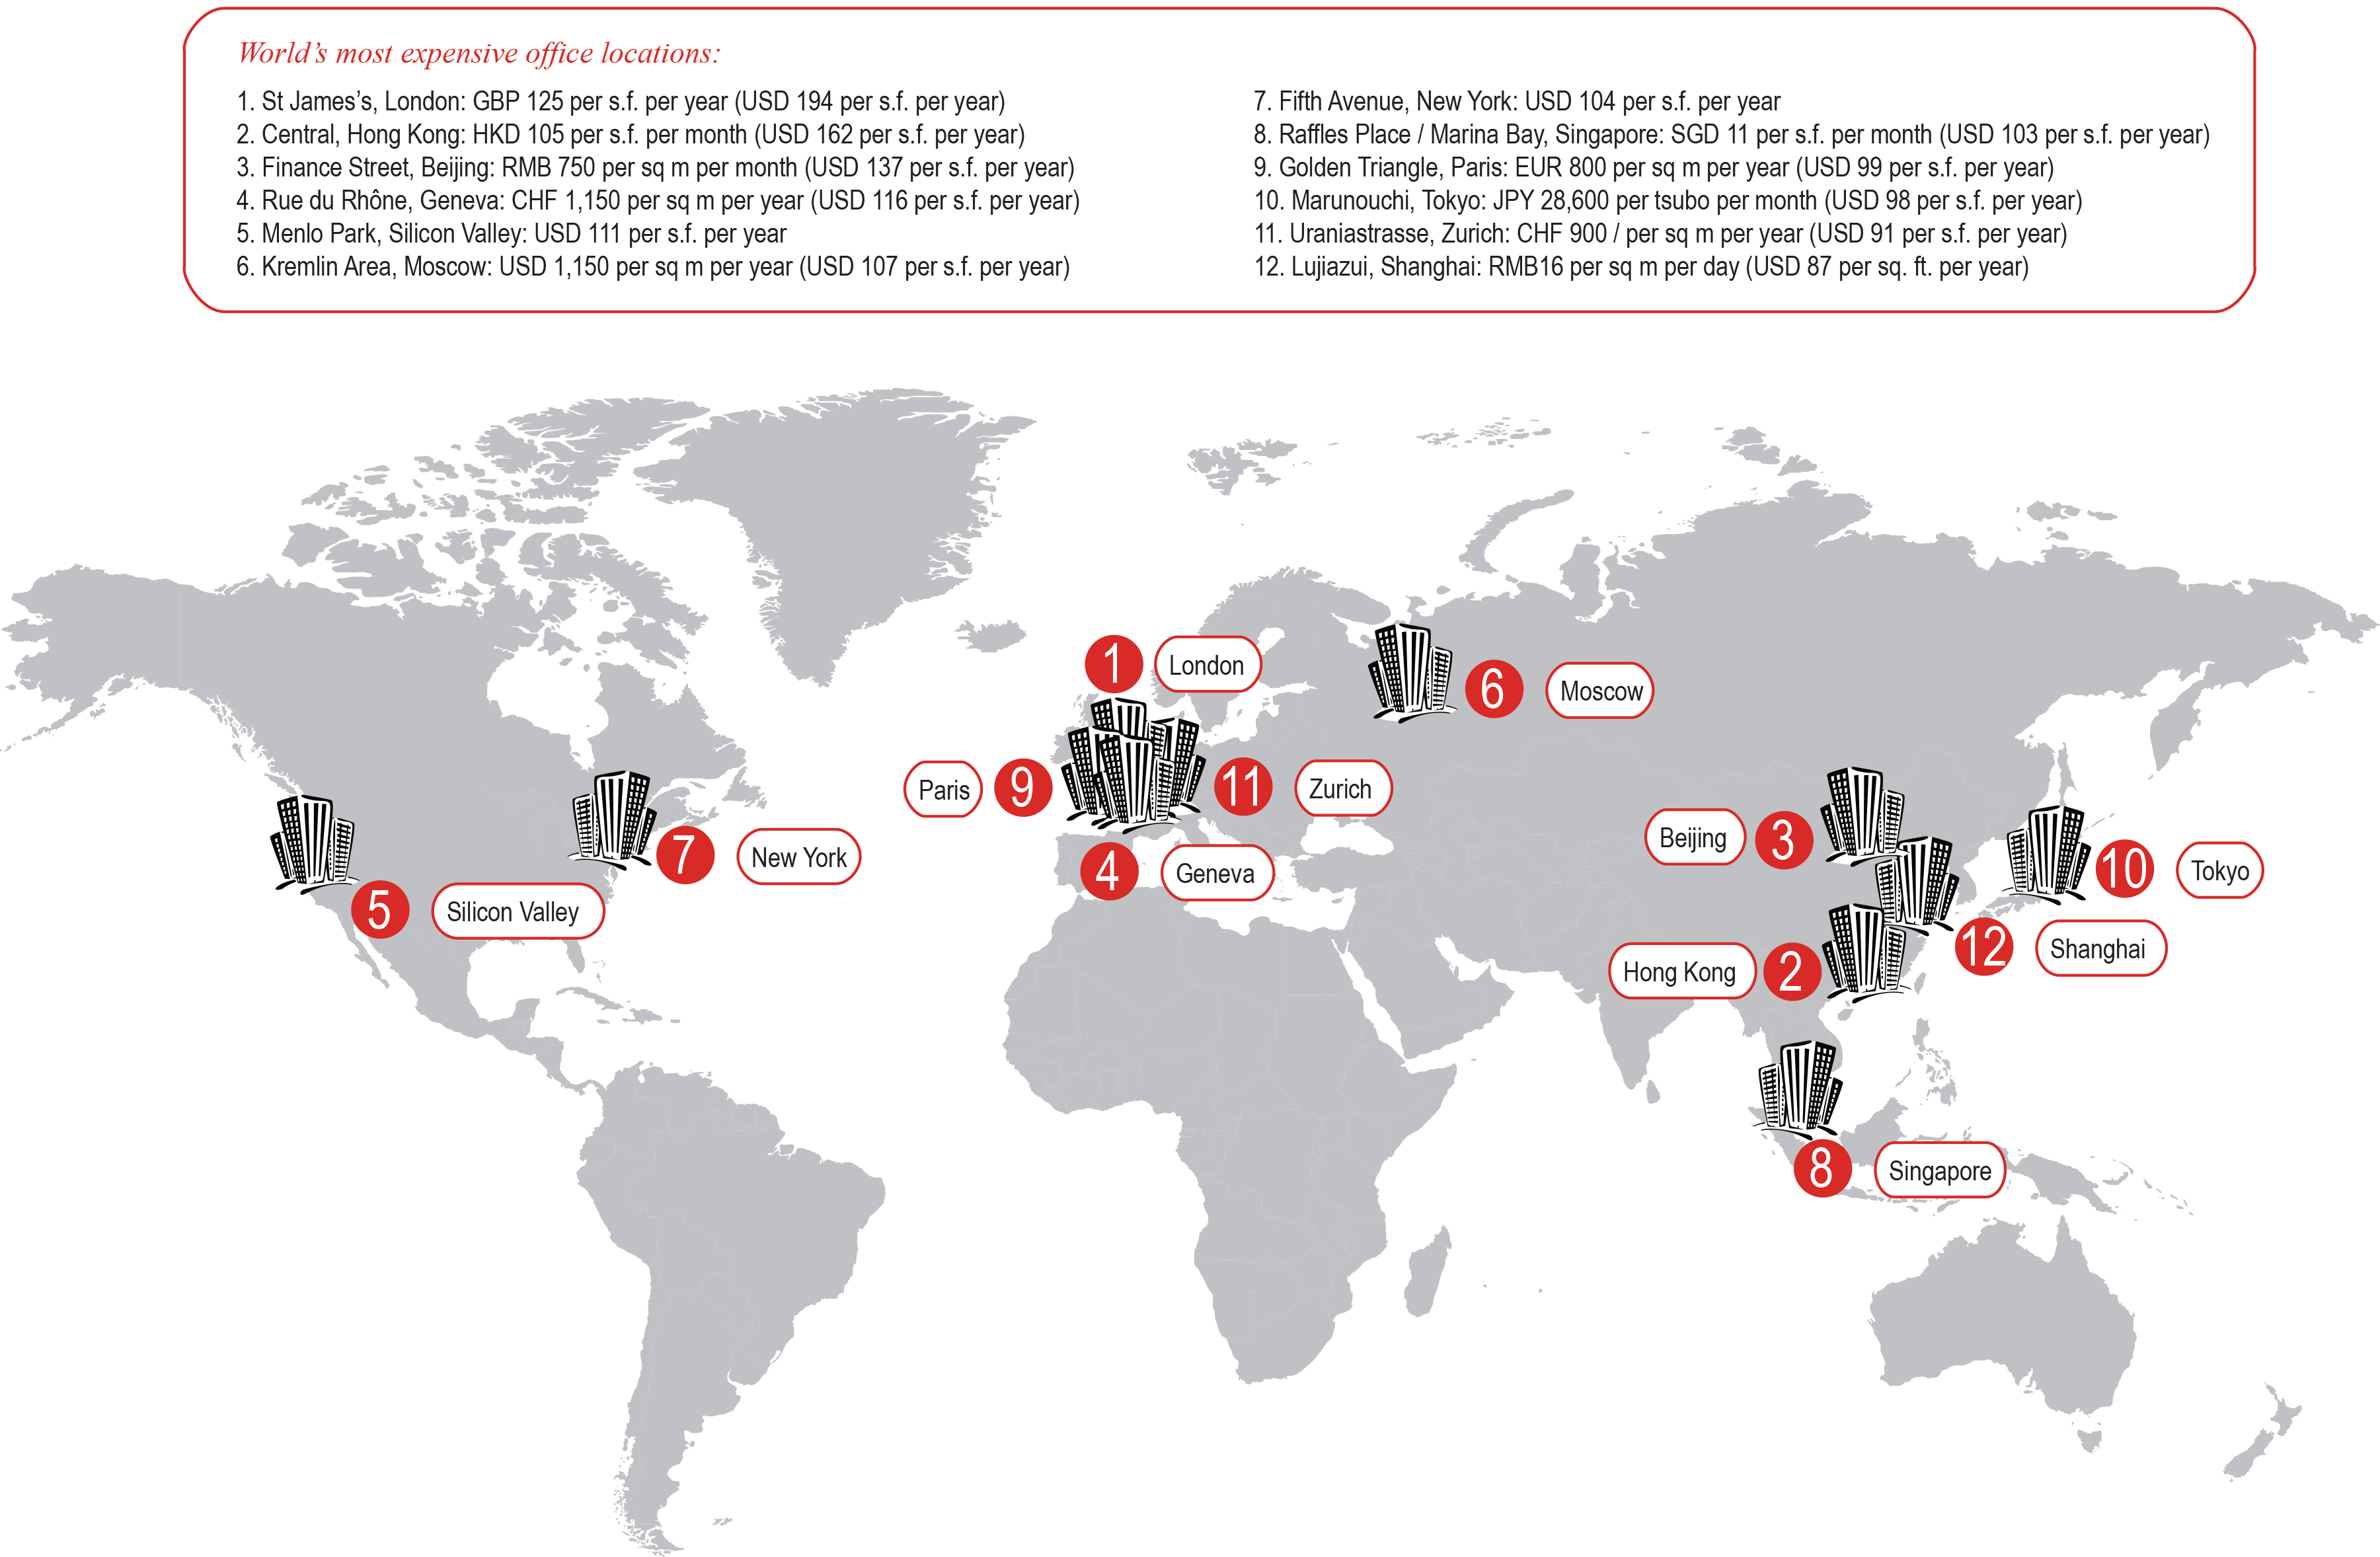
Key Commodities and Emerging Markets

emerging market dominate commoditiesCommodities are raw materials essential for the production of more complex products. Commodities fall into three large categories: agricultural, energy, and metals.

According to this visualization, emerging economies (Brazil, Russia, India Indonesia, China, South Africa, etc.) have the largest reserves of certain key energy and metal commodities such as oil, coal, copper, cobalt, iron ore, molybdenum, nickel, zinc, and aluminum.

Source: Business Insider: 36 Maps That Explain The Entire World


The 50 Largest Ports in the World

worlds 50 largest portsEvery day finished goods and commodities are transported  by sea in shipping containers from one port to another across the globe. Standard shipping containers measure 20 feet long by eight feet wide, hence they receive the name of “Twenty-foot Equivalent Units” or TEUs.

The largest port in the world is in Shanghai (China) which saw a volume of 31.74 million TEUs of cargo freight passing through its port in 2011. Shanghai is followed by Singapore (Singapore) which saw a volume of 29.94 million TEUs passing through its port for the same year. Singapore is followed by Hong Kong, Shenzhen (China), Busan (South Korea), Ningbo, Guangzhou, and Qingdao (China), Dubai Ports (United Arab Emirates), and Rotterdam (Netherlands), all in the top ten.

For the interactive map, that allows you to explore each one of the largest 50 ports in the world, visit: The Smithsonian: Interactive: The 50 Largest Ports in the World


The World’s Largest Oil Reserves by Country

strategic oil reserves worldOil reserves are the amount of oil that can be technically and economically recovered from the ground.

Nations with the world’s largest oil reserves include Saudi Arabia, Venezuela, Iran, Iraq, Kuwait, United Arab Emirates, Russia, and Libya. Saudi Arabia, holds an approximate 234.5 billion barrels of oil reserves, and it has the largest market share for oil production after Russia. Saudi Arabia is followed by Venezuela, with an estimated 211.0 billion barrels of oil reserves, although its current oil production market share is only 3.2%.

By comparison, the United States has an estimated 30.9 billion barrels in oil reserves, and  8.7% market share in oil production.

Source: Spiegel Online: A World without Oil: Companies Prepare for a Fossil-Free Future


Crude Oil Exports and Imports by Country

crude net balance by countryVast quantities of crude oil are exported and imported each year. Some countries are net exporters (their oil exports are larger than their oil imports), and some are net importers (their oil imports are larger than their exports).

In this visualization by Data Driven Consulting, we can see that the United States was the largest net importer of crude oil in 2009. Other net importer countries include China, India, Japan, South Korea, Germany, Belgium, Italy, UK, Spain, Singapore, and Australia.

Among the net exporters of crude oil we find Russia, Saudi Arabia, Iran, Iraq, Norway, Venezuela, Mexico, and Canada.

For the full-size interactive dashboard, visit: Tableau Public: Exporters and Importers


Internet Connectivity in the United States

As part of the PBS series America Revealed, this aerial visualization shows the patterns of internet distribution in the United States. We can see that the regions with highest levels of internet connectivity include the Northeast, and parts of the South and Midwest, followed by the Pacific West.

For additional interesting aerial visualizations, such as the distribution of the unemployed, electricity network routes, public transportation paths, U.S. imports and exports of beef patterns, the distribution of the population in towns and cities, etc., visit: The Roosevelt’s – Aerial Data Visualisation Reveals Life In The United States.

Fossil Fuel Subsidies Globally

Fossil fuel subsidies are very common in developing nations. Subsidies cover the difference between the price at which fossil fuels are sold inside the country and their actual price in international markets, creating a huge fiscal burden (an estimated $400 billion annually) for the countries that provide them. Developing nations with fossil fuel subsidies include: Venezuela, Argentina, Ecuador, Algeria, Libya, Egypt, Kuwait, Iran, Pakistan, Russia, China, India, Indonesia, etc.

Developed nations also provide subsidies in the form of tax breaks to the oil industry and other measures (estimated at a cost of $45 to $75 billion per year). Nations in this group include many OECD (Organization for Economic Co-operation and Development) members.

For the interactive map, visit: National Geographic: The Great Energy Challenge: Fossil Fuel Burden on State Coffers


Milk Consumption Per Capita Worldwide

Milk and milk products are consumed all over the world on a daily basis. As shown in the graph above, the largest consumers of milk in the Americas are the U.S., Canada, Nicaragua, and Argentina. In Europe the largest consumers of milk are Sweden, Finland, Netherlands, Switzerland, Portugal, Greece, and Kazakhstan. In Africa, we have Sudan and South Sudan. Australia is also one of the largest consumers of milk.

The consumption of milk in this map is defined as Kg. of milk consumed per person per year.

Resource: Food Beast: Map of Milk Consumption & Lactose Intolerance Around the World


Food Exports and Imports Worldwide

Some countries are net exporters of food (their food exports are larger than their food imports) while others are net importers of food (their food imports are larger than their food exports).

Among the net exporters of food we find the majority of South American countries, with the exception of Venezuela and Suriname, the United States, Canada, Mauritania, Indonesia, Australia, and a few African countries such as Mauritania, Ivory Coast and Ghana. The largest net exporter of food, by far, is Argentina with $23.42 of food exports per every $1.00 of food imports. Argentina is followed by Brazil, New Zealand, Paraguay and Iceland.

Among the net importers of food we find countries such as Russia, Finland, Sweden, the UK, Italy, Germany, Portugal, Sudan, Cuba, Saudi Arabia, Japan, etc. The largest net food importer is Eritrea, with $0.01 of food exports per every $1.00 of food imports. Eritrea is closely followed by Venezuela, Turkmenistan, and Algeria.

Data for for both agricultural exports and imports are for 2010.

Source: Slate.com: Maps: Agriculture in the U.S. and Around the World


Sweet Deal: The Global Trade of Chocolate

click to enlarge

This visualization by The Guardian, actually made out of real chocolate, depicts the world trade (exports and imports) of chocolate. Between 2010 and 2011, 4.24 million tons of cocoa beans were processed worldwide.

The top cocoa bean producers are: Ivory Coast, Ghana, Indonesia, Nigeria, Cameroon, Brazil, and Ecuador, among others. The top importers include: Netherlands, the United States, Germany, Malaysia, Belgium, France, the UK, and Spain.

For a list of the top global confectionery companies, visit: International Cocoa Organization: The Chocolate Industry


Coffee Consumption Per Capita Worldwide

Coffee production and consumption is believed to have originated in Africa, more specifically in the province of Kaffa, Ethiopia. In the fifteen century it was already present in the Middle East. From there it spread to Italy and then to the rest of Europe. From Europe it traveled to the New World, where it was first cultivated in the Caribbean island of Martinique. During the first quarter of the eighteen century it was brought to Colombia and Brazil.

Coffee is an important cash crop in many developing countries. It is also an important commodity traded in major commodity exchanges around the world. The largest coffee producers include: Burundi, Ethiopia, Rwanda, Honduras, Uganda, and Nicaragua among others.

According to ChartsBin, coffee consumption around the world is estimated at 1.3 Kilograms per person per year (a total of 7,358,897 metric tons). In the map above, we can see that the countries with the largest coffee consumption per capita include: Finland (12 Kg. per person per year), Norway, Iceland, Denmark, Netherlands, Switzerland, followed by Canada, Germany, Brazil and other western European nations.

Sources: