Category Archives: World

Worldwide Remittance Flows

world remittance flows 2012
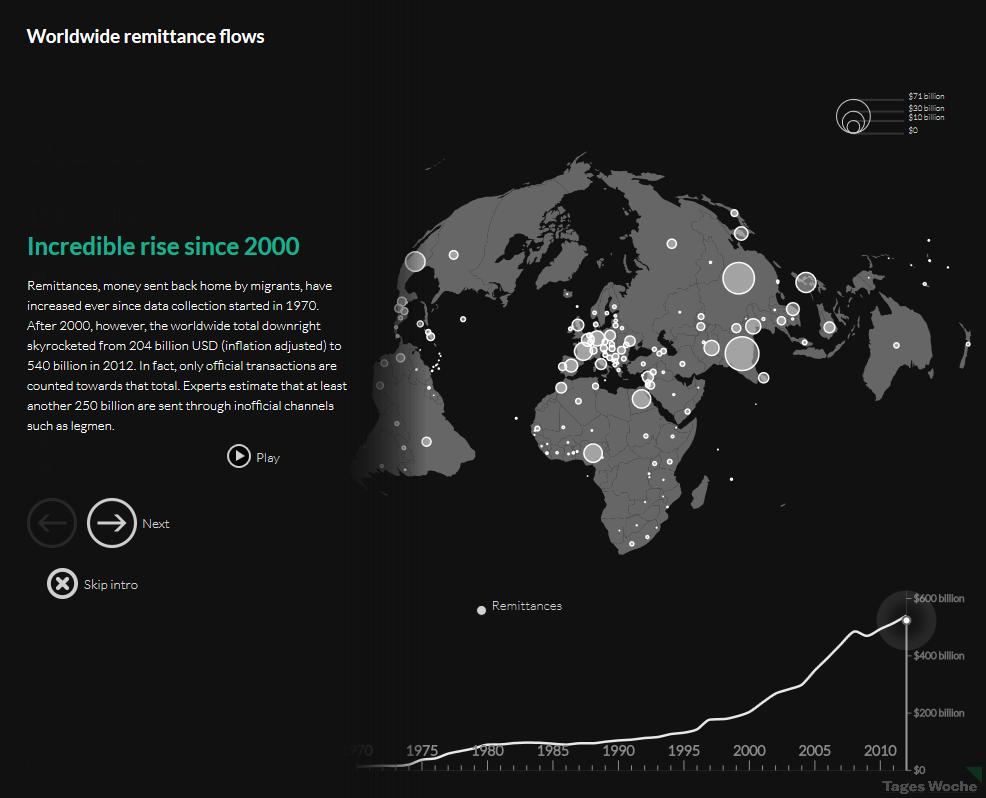
Remittances, or money sent by migrant workers to their home countries, have increased since the year 2000. Although, they temporarily decreased after the economic crisis back in 2008, they recovered in 2010 and continued to rise. Remittances increased from $204 billion back in 2000 to $540 billion in 2012.

Countries with the highest remittance inflows include India ($71 billion), China ($62 billion), Mexico, the Philippines, Nigeria, Egypt, and France. Only nine countries saw a reduction in remittance inflows, among them Greece and Turkey which experienced the steepest decline.

For the interactive map, please visit: Tages Woche: The incredible rise of migrants’ remittances


Basic Salary of Lawmakers by Country

basic salary of lawmakers by country 2013How much lawmakers are paid is a sensitive issue especially in times of economic austerity, or in countries where the majority of the population lives in extreme poverty conditions.

In this chart prepared by The Economist, we can see how much lawmakers are being paid in different countries across the globe in U.S. dollars (left), and as a ratio of the gross domestic product (GDP) per capita (right).

In Nigeria, for example, lawmakers receive a basic salary of $189,000, 116 times the country’s GDP per capita. In Kenya a lawmaker makes a basic salary of $74,500, 76 times the country’s GDP per capita. Other countries were lawmakers receive the heftiest salaries include Ghana, Indonesia, South Africa, Brazil, Thailand, and India. It is worth pointing out that most of these countries are some of the poorest in the world.

In comparison, in the wealthiest nations a lawmaker’s salary as a ratio of GDP is much smaller. In Britain, that ratio is 2.7 of the GDP per capita.


The Failed States Index 2013

failed state index 2013Fund For Peace just released the Failed State Index (FSI) 2013. The FSI measures the level of risk in each country using a series of risk indicators such as mounting demographic pressures, massive movement of refugees, uneven economic development, poverty, legitimacy of the state, progressive deterioration of human services, violation of human rights, violation of the rule of law, security apparatus, intervention of external actors, etc. The FSI is calculated for a total of 178 countries.

Nations ranking at the top for failed states (red) include Somalia, Congo, Sudan, and South Sudan. Unfortunately, most of the world’s nations seem to be under a warning (orange) for failed states, from Africa to Asia to Latin America.

For the complete list of countries, rankings and scores, please visit: Fund For Peace: Failed State Index (FSI) 2013


Violence Against Women by World Region

violence against womenIn this chart published by The Economist we look at two sets of data about violence against women.

The first one shows that more than a third (39%) of homicides of women around the world are committed by a previous or current partner. The numbers are specially shocking for South East Asia (Cambodia, Laos, Myanmar [Burma], Thailand, Vietnam, Brunei, Malaysia, East Timor, Indonesia, Philippines, and Singapore). The numbers are also high for Latin American and African countries.

The second set of data shows that 30% of women around the world have experienced physical or sexual violence during their lifetime by a former or current partner. The numbers are the highest for Central African countries (Burundi, Central African Republic, Democratic Republic of the Congo, and Rwanda),  followed by countries in West Africa (Benin, Burkina Faso, Ivory Coast, Ghana, Liberia, Nigeria, Senegal, Sierra Leone, etc.), South Asia (Afghanistan, Bangladesh, Bhutan, India, Maldives, Nepal, Pakistan, and Sri Lanka), the Andean region of South America (Colombia, Venezuela, Ecuador, Peru, and Bolivia), the Middle East, and North Africa.


World Population Growth Over Time

population growth over time 1800-2050

World population growth accelerated in the last century. During the twentieth century alone, the number of people increased from 1.5 billion to 6 billion.

In the year 1800 the world’s population had reached 1 billion, with most people living in Asia and Europe. By 1927, 127 years later, the population of the world had doubled, reaching an staggering 2 billion people.

population growth over time 1927Population growth remained almost the same until 1950 when advances in science and medicine increased life expectancy, specially in developed nations.

The world’s population reached 3 billion inhabitants by 1960, 4 billion by 1974, 5 billion by 1987, 6 billion by 1999, 7 billion by 2011.

population growth over time 2050It is estimated that the population of the world will reach 8 billion by 2024, and 9 billion by 2050. Most of the growth will occur in developing nations

Source: NOVA: Human Numbers Through Time


Global Carbon Footprint by Country

carbon footprint by countryThis original visualization by Stanford Kay shows total carbon emissions by country. Using different colors to differentiate each region, the size of the circle depicts the carbon footprint of each country.

Countries with the largest carbon footprint include China, United States, Russia, India, Japan, Germany, South Korea, Australia, UK, Iran, Saudi Arabia, Brazil, Taiwan, Ukraine, France, and Spain.


The World’s Abortion Laws by Country

world abortion laws 2013Latin American countries along with countries in the Middle East and Africa have the most restrictive abortion laws.

According to this map by the Center for Reproductive Rights, in countries like Argentina, Brazil, Mexico, Venezuela, Syria, Iran, Iraq, Afghanistan, Yemen, Oman, Egypt, Libya, Indonesia, etc. (shown in red) abortions are allowed in some cases only to save a woman’s life, or in most cases they are banned altogether.

In general, most developed nations have less restrictive abortion laws, although some 12 states in the U.S. have passed more restrictive laws banning abortion after 20 weeks of gestation.


Extradition Treaties of the U.S. with Other Countries

american extradition treatiesAn estimated 100 countries have signed bilateral extradition treaties with the United States, including all Latin American countries, Western European countries, Egypt, India, Australia, and New Zealand to name a few. Some 60 nations including China, Russia, several Middle Eastern and African countries have not. However, even if some countries signed extradition treaties they can still refuse to hand an individual over to the U.S. if that person is seeking asylum or if he/she would face the death penalty.

Source: The Economist: Daily Chart: Where can he go?


Global Acceptance of Homosexuality

global homosexuality acceptanceIn light of the recent Supreme Court’s Defense of Marriage Act (DOMA) ruling in favor of same-sex marriage, we found this interesting visualization showing the global great divide among nations regarding the acceptance of homosexuality.

Countries where homosexuality is accepted include Spain (88%), Germany (87%), Czech Republic (80%) Canada (80%), Australia (79%), Philippines (73%), Argentina (74%), Italy (74%), Chile (68%), among others.

On the other side of the spectrum, there are countries where homosexuality is less acceptable, or not acceptable at all. Those countries include Nigeria (1%), Pakistan (2%), Tunisia (2%), Ghana (3%), Egypt (3%), Jordan (3%), Indonesia (3%), and Senegal (3%) to name a few.

Source: Pew Research Center: Global Acceptance of Homosexuality


Male and Female Literacy Rates by Country

global literacy ratesLiteracy rate is defined as the number of people 15 years or older who can read and write. According to a study published by the Oxford Internet Institute at University of Oxford, global literacy rate is 82%. While the literacy rate for men is 87%, the rate for women is 77%.

Looking at data per continent, we find that countries in the Americas are highly literate, 99% for both men and women in the United States, and 97% for both men and women in Argentina. European countries show high literacy rates as well, above 91% for both men and women.

Many nations in Asia also show high literacy rates, except for countries like India, certain neighboring countries and countries in the Middle East, where the literacy rates are even lower for women.

Most African countries have very low literacy rates, with few exceptions: South Africa, Lesotho, Kenya, and Namibia.