Category Archives: Topics

Life Expectancy vs. Fertility Rates Worldwide 1960-2010

click to enlarge

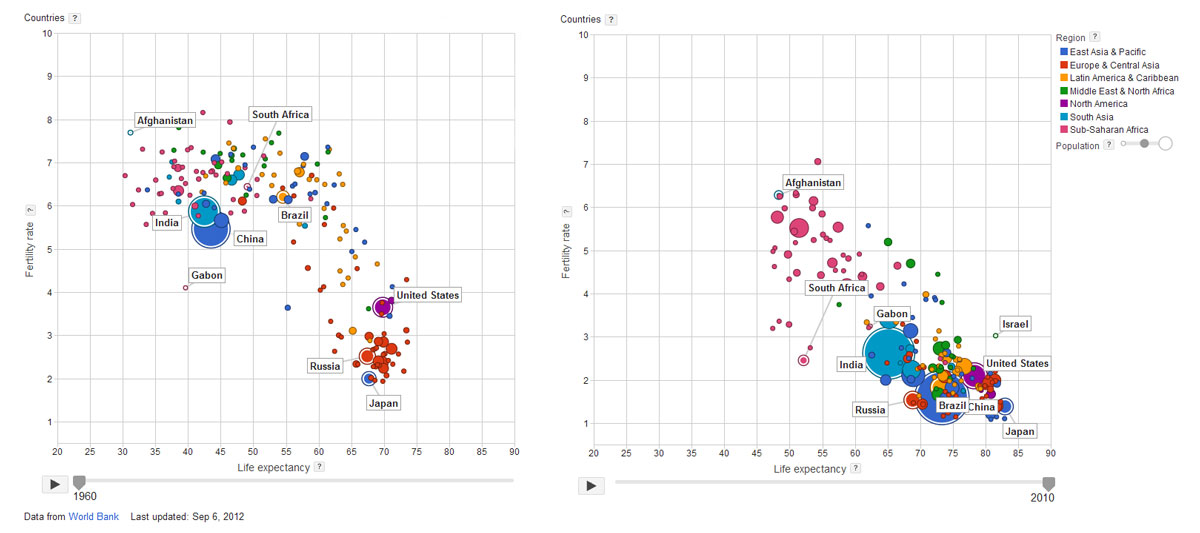
During the last fifty years, we have seen the gradual increase in life expectancy and the corresponding decrease in fertility rates worldwide. This is clearly the case of countries like China, India, the United States, Brazil, Japan, and Gabon, where dramatic improvements can be seen. On the other hand, countries like Russia, South Africa and Afghanistan, show moderate improvement.

It is very interesting to note, that although they have improved, a large cluster of African countries remain far from the overall trend, with lower life expectancy rates and higher fertility rates. For more information, check Google’s interactive bubble chart based on World Bank data.


How Does Your Country Compare to U.S. States?

These interactive maps from the Economist provide an interesting comparison between different countries and US states.

Using the criteria of GDP (Gross Domestic Product), the economy of California is approximately the size of Italy, Texas the size of Russia, Florida the size of the Netherlands, and Alabama the size of Nigeria.

Using the criteria of Population, California is approximately the size of Poland, Washington  the size of Lebanon, Arizona the size of Libya, and Minnesota the size of Finland, to name a few.


Bleak Estimates for Corn Yields and Grain Stocks for 2012

According to the Earth Policy Institute, drought conditions have generated bleak corn yield estimates for the remainder of 2012. Corn yields for September 2012 are estimated at 123 bushels per acre, which would make it the lowest yield since 1995. Compare this yield to the highest ever value of 165 bushels per acre, which was last reached in 2009.

As a consequence, the price of corn has increased significantly. It reached a record high of $8 per bushel in the corn futures market back in July, and has fluctuated around that price since then. Another consequence is the expected fall in global grain supplies. Supplies are expected to fall to 432 million tons, or 69 days of global consumption.

Poverty in the U.S.

According to data just released by the U.S. Census Bureau, 15% of the population lives in poverty, that is 46.2 million of people. Those numbers are not statistically different from the 2010 estimates. In 2011 the poverty threshold for a family of four was $23,021.

The poverty rate for males decreased between 2010 and 2011 to 13.6%, and remained the same for females at 16.3%. The poverty rate for Hispanics declined between 2010 and 2011. By age, the group with the highest poverty rate was that of children under 18 at a rate of 21.9%. By region, the only region to show a significant change was the South with a decline in the poverty rate from 16.8% to 16.0%. Read more…


Will China Dominate the World Beer Market?

According to a report by the Kirin Institute of Food and Lifestyle, in 2010 China remained the largest consumer of beer for the eight consecutive year. China’s beer consumption increased 5.9% with respect to 2009, with a share of 24.5% of total world beer consumption.

In the world trade arena, though, China is still a small player. China’s imports of beer for 2010 amounted to only 0.56% of total world beer imports, way below the United States (37%), France (6.8%) and the UK (6.6%). China’s exports for the same year amounted to only 1.4% of total world beer exports, below Mexico (21%), the Netherlands(19%), Germany (13%), and the United States (3.4%) to name a few. However, because of the size of China’s economy, there is a huge potential for the world’s largest beer exporters to see China with a lot of optimism. Read more…


The Role of Social Media in Politics

The role of social media in the political arena has increased considerably as of lately. During the Democratic National Convention, last week, it was clear that social media was an important channel for disseminating information as events were taking place. According to the online site TechCrunch, first lady Michelle Obama’s speech had generated 28 thousand tweets per minute.

A report published by the Pew Research Center, based on a survey on social network site users, states that Democrats are more likely to consider the use of social media important or very important in keeping up with political news, recruiting people for their cause, discussing political issues with other people and finding other people who share their political views, compared to their Republican or Independent counterparts.

West Nile Virus Cases by County

West Nile Virus cases in the US as of August 21, 2012

The current outbreak of West Nile virus in the US is the most serious since the disease was first detected in the country in 1999. Thus far, 1118 cases have been reported to the Centers for Disease Control and Prevention (CDC), including 41 deaths. Find out if any cases have been detected in your county by clicking on the map above.

Do You Live in a “Healthy” State?

According to data from the Center for Disease Control and Prevention (CDC), most states have become healthier in terms of physical activity for the years between 2001 and 2007, excluding Louisiana and Mississippi which have less than 40% of healthy residents.

The CDC defines as “healthy people” those who engage in moderate-intensity physical activity at least 5 days a week for 30 minutes a day, or those who engage in vigorous-intensity physical activity at least 3 days a week for 20 minutes a day.

It is interesting to note, though, that data displayed on these maps tells a different story than data for the obesity rate in the United States. As we showed on a previous post, the obesity rate in the U.S. has been rising steadily since at least 1991. There is a clear contradiction between the rise in obesity rates and the rise in the percentage of healthy people.


Industrial Production, Producer Prices and Consumer Confidence

Industrial production is up for the month of July, with a 0.6% increase. So is the core Producer Price Index (excludes energy and food) with an increase of 0.4%. Consumer confidence varies from state to state, with optimistic states located around the District of Columbia area and the Midwest, and pessimistic states mostly in the southern part of the country. Read below:

  1. Three Numbers to Watch: US Industrial Production,CPI; UK Unemployment – Yusuf Yassin [TradingFloor.com]
  2. Industrial Production Climbs 0.6% in July – Steve Goldstein [Market Watch]
  3. Producer Prices Come In A Bit Higher Than Expected – Sam Ro [Business Insider]
  4. Consumer Confidence Varies from State to State – Interview with Frank Newport [Marketplace]
  5. U.S. Durable Goods Orders Drop in June – Agence France-Presse [IndustryWeek]

Obesity in America: An Upward Trend

Obesity Trends Among US Adults 1991-2010
(BMI ≥ 30 lbs, or 30 lbs overweight for 5’4″ women)

Obesity has increased dramatically in the last twenty years. Mississippi has the highest percentage of obese adults, 34.9 %, followed by other twelve states with percentages higher than 30%. Most of these states are located in the Midwest and South. Is your state among the “fattest” states? Read more:

  1. STUDY: Mississippi Is The Fattest State – Ian Simpson, Reuters [Business Insider]
  2. Obesity Related Statistics in America [Get America Fit Foundation]
  3. Obesity could affect 42% of Americans by 2030 – Nanci Hellmich [USA Today]
  4. Adult Obesity Facts [Centers for Disease Control and Prevention]
  5. Junk Food Laws May Be Answer to Kids’ Obesity, Study Says [Fox News Latino]
  6. Childhood Obesity Facts [Centers for Disease Control and Prevention]