Category Archives: Maps

Crude Oil Exports and Imports by Country

crude net balance by countryVast quantities of crude oil are exported and imported each year. Some countries are net exporters (their oil exports are larger than their oil imports), and some are net importers (their oil imports are larger than their exports).

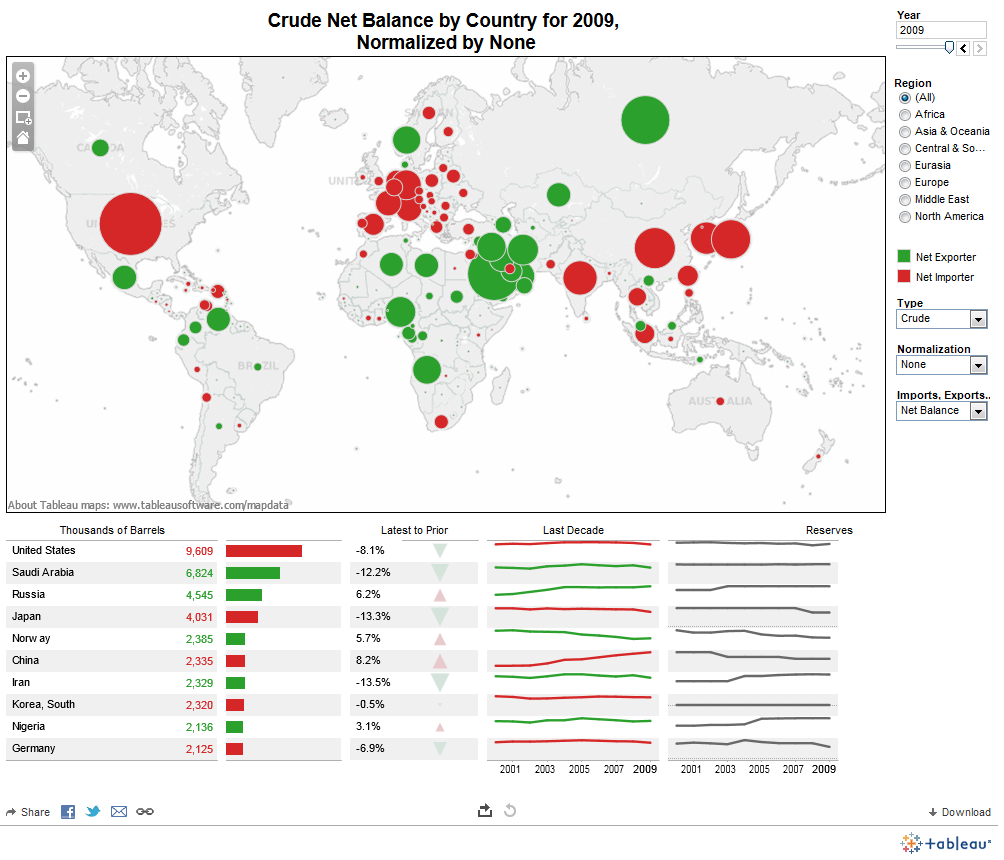
In this visualization by Data Driven Consulting, we can see that the United States was the largest net importer of crude oil in 2009. Other net importer countries include China, India, Japan, South Korea, Germany, Belgium, Italy, UK, Spain, Singapore, and Australia.

Among the net exporters of crude oil we find Russia, Saudi Arabia, Iran, Iraq, Norway, Venezuela, Mexico, and Canada.

For the full-size interactive dashboard, visit: Tableau Public: Exporters and Importers


North Korean Missiles

maximum range of north korean missiles

North Korea possesses a variety of missiles with different range capabilities. On one hand, there is the Scud-V with a range of less than 1,000 Km. that will easily reach South Korea, on the other there is the Taepodong-3 with a range of 10,000 Km. that could potentially reach the U.S. and Canada, as well as Europe.

In terms of balance in the conflict zone, North Korea outnumbers South Korea and the US forces combined in number of troops, tanks, aircraft and navy vessels.

Source: News Agency Ria Novosti

Suggested reading: The Brookings Institution: North Korea and Nuclear-Armed Missiles:  Calming the Hyperbole


Gasoline Prices in Europe by Country

According to Russian news agency Ria Novosti, Norway has the highest gasoline price among European countries, with a price of 1.90 Euro per liter ( or US $9.475 per gallon at the current exchange rate of 1 Euro = US $1.31). Norway is followed by Italy, Netherlands, Sweden, and Greece.

The lowest gasoline prices are found in Belarus and Kazakhstan, 0.68 Euros and 0.70 Euros per liter, respectively. The average gasoline price for European nations is 1.39 Euros per liter.


Alcohol Consumption Per Capita by Country

Alcohol consumption per capita by country

According to the the World Health Organization (WHO), alcohol consumption by adults on a per-capita basis is highest primarily in Eastern Europe. The Global Status Status Report on Alcohol and Health ranks Moldova, Hungary, and Russia at the top of the list. In Moldova, adults consume 18.22 liters of alcohol per year through a combination of beer, wine and spirits. How much alcohol is consumed in your country?

Terrorist Attacks in the U.S. Since 1970

The Guardian has published this interactive map pinpointing the location of terrorist attacks in the United States since 1970.

A total of 2,455 incidents have occurred between 1970 and 2011. Most of the attacks have happened in the Northeast, and the largest number of casualties is also concentrated in that region (large-size circles).

Source: The Guardian: Data Blog – Four decades of US terror attacks listed and detailed


Total Carbon Emissions by Country

The Kyoto Protocol is an international treaty that seeks the reduction of greenhouse gases that contribute to global warming by setting emission reduction targets for industrialized nations. The Kyoto Protocol was signed on December 11, 1997 in Kyoto (Japan) by 191 countries. The United Stated signed the treaty, but later it did not ratify it.

This visualization by The Guardian shows total carbon emissions by country between 1997 and 2007, ten years since the protocol was signed.

The United States is the country that has produced the largest amount of carbon emissions (64,166 million tonnes) in the period 1997-2007 followed by China, Russia, Japan, India, and Germany.

Asia and Oceania combined are the regions with the highest carbon emissions produced in the same period (96,306 million tonnes). Asia and Oceania are followed by North America (U.S., Canada, and Mexico) with carbon emissions of the order of 74,867 million tonnes, and Europe with carbon emissions at 50,370 million tonnes as of 2007.


World Internet Users by Region

Of the 7 billion people in the world, only 2.4 billion are connected to the Internet, that is roughly 34% of the population as of 2012.

Internet penetration is the highest in North America (79%), followed by Oceania (68%), Europe (63%), and Latin America (43%).

Source: Statista: Only a Third of the World’s Population Is Online


Internet Connectivity in the United States

As part of the PBS series America Revealed, this aerial visualization shows the patterns of internet distribution in the United States. We can see that the regions with highest levels of internet connectivity include the Northeast, and parts of the South and Midwest, followed by the Pacific West.

For additional interesting aerial visualizations, such as the distribution of the unemployed, electricity network routes, public transportation paths, U.S. imports and exports of beef patterns, the distribution of the population in towns and cities, etc., visit: The Roosevelt’s – Aerial Data Visualisation Reveals Life In The United States.

Death Sentences and Executions by Country

In this visualization by The Guardian, based on data from Amnesty International, we can see which countries still use the death penalty.

In 2012, 1,923 people were handed out a death sentence in 58 countries, and 976 executions were carried out in 20 countries.

China is by far the country that has carried out the largest number of executions, more than the rest of the world combined. Numbers are not know, though, since China keeps that information secret. China is followed by Iran, Iraq, Saudi Arabia, Kuwait, the United States, Yemen, Sudan, and Somalia.


Body Mass Index (BMI) by Country

A body mass index (BMI) between 18.5 and 24.9 is usually considered a healthy body weight to height relationship. A BMI of 25 or higher indicates body weight not optimal for the height of a particular person.

This visualization published by Visual.ly, shows the different BMI values for adult men and women across the globe.

Countries with a healthy average BMI between 20 and 22.9 include several nations in Africa, Yemen, India, Thailand, Japan, Pakistan, Singapore, among others.

Countries with an average BMI between 23 and 24.9 include several Asian nations, several European nations (including France), some nations in Africa, and Honduras.

Countries with an average BMI between 25 and 26.9 include Canada, Russia, Costa Rica, Colombia, Israel, Austria, Switzerland, Brazil, all Nordic countries, Spain, Portugal, and nations in the Middle East.

Countries with an average BMI of 27 and over  (the highest BMI range) include the United States, Kuwait, Cuba, Argentina, Chile, Bolivia, Peru, Venezuela, Australia, UK, New Zealand, Greece, and Germany to name a few.