Category Archives: Europe

Male and Female Literacy Rates by Country

global literacy rates
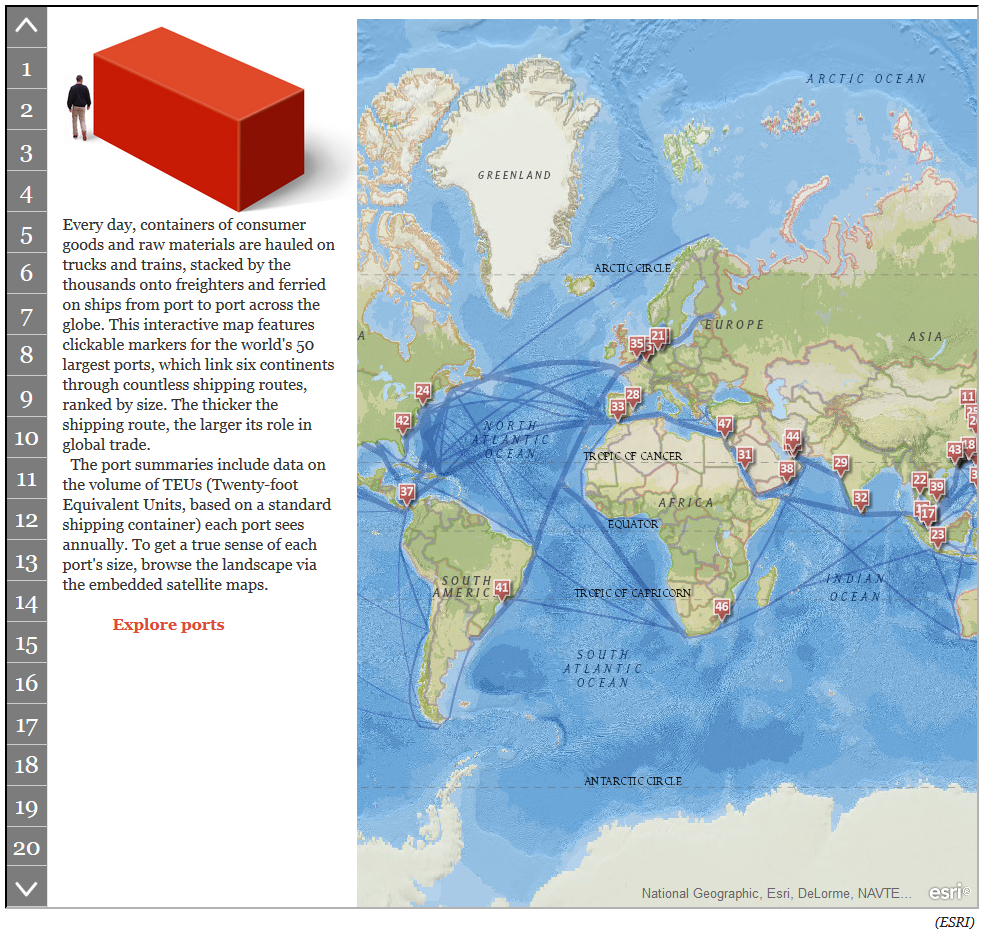
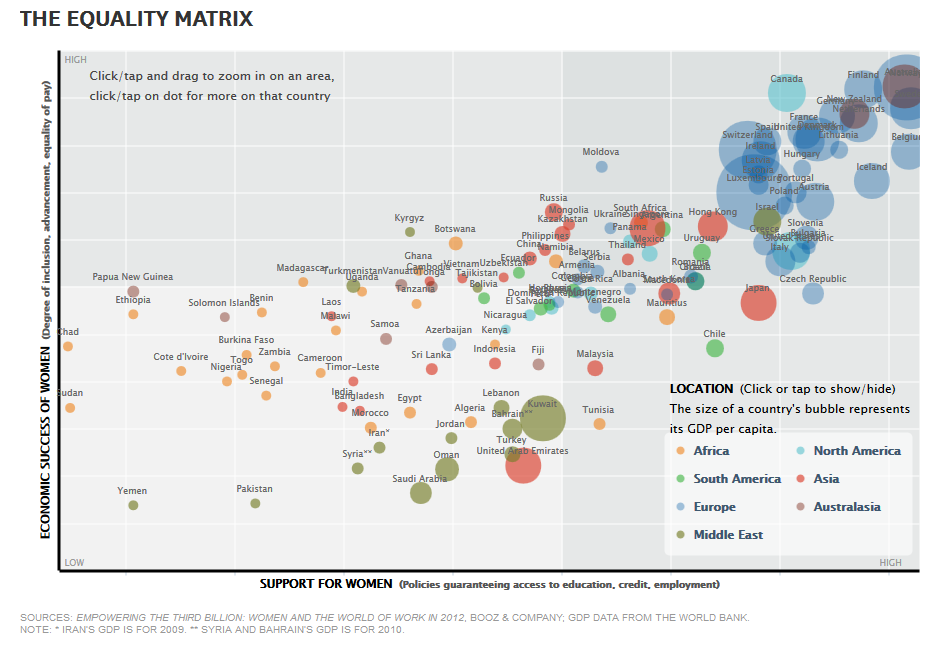
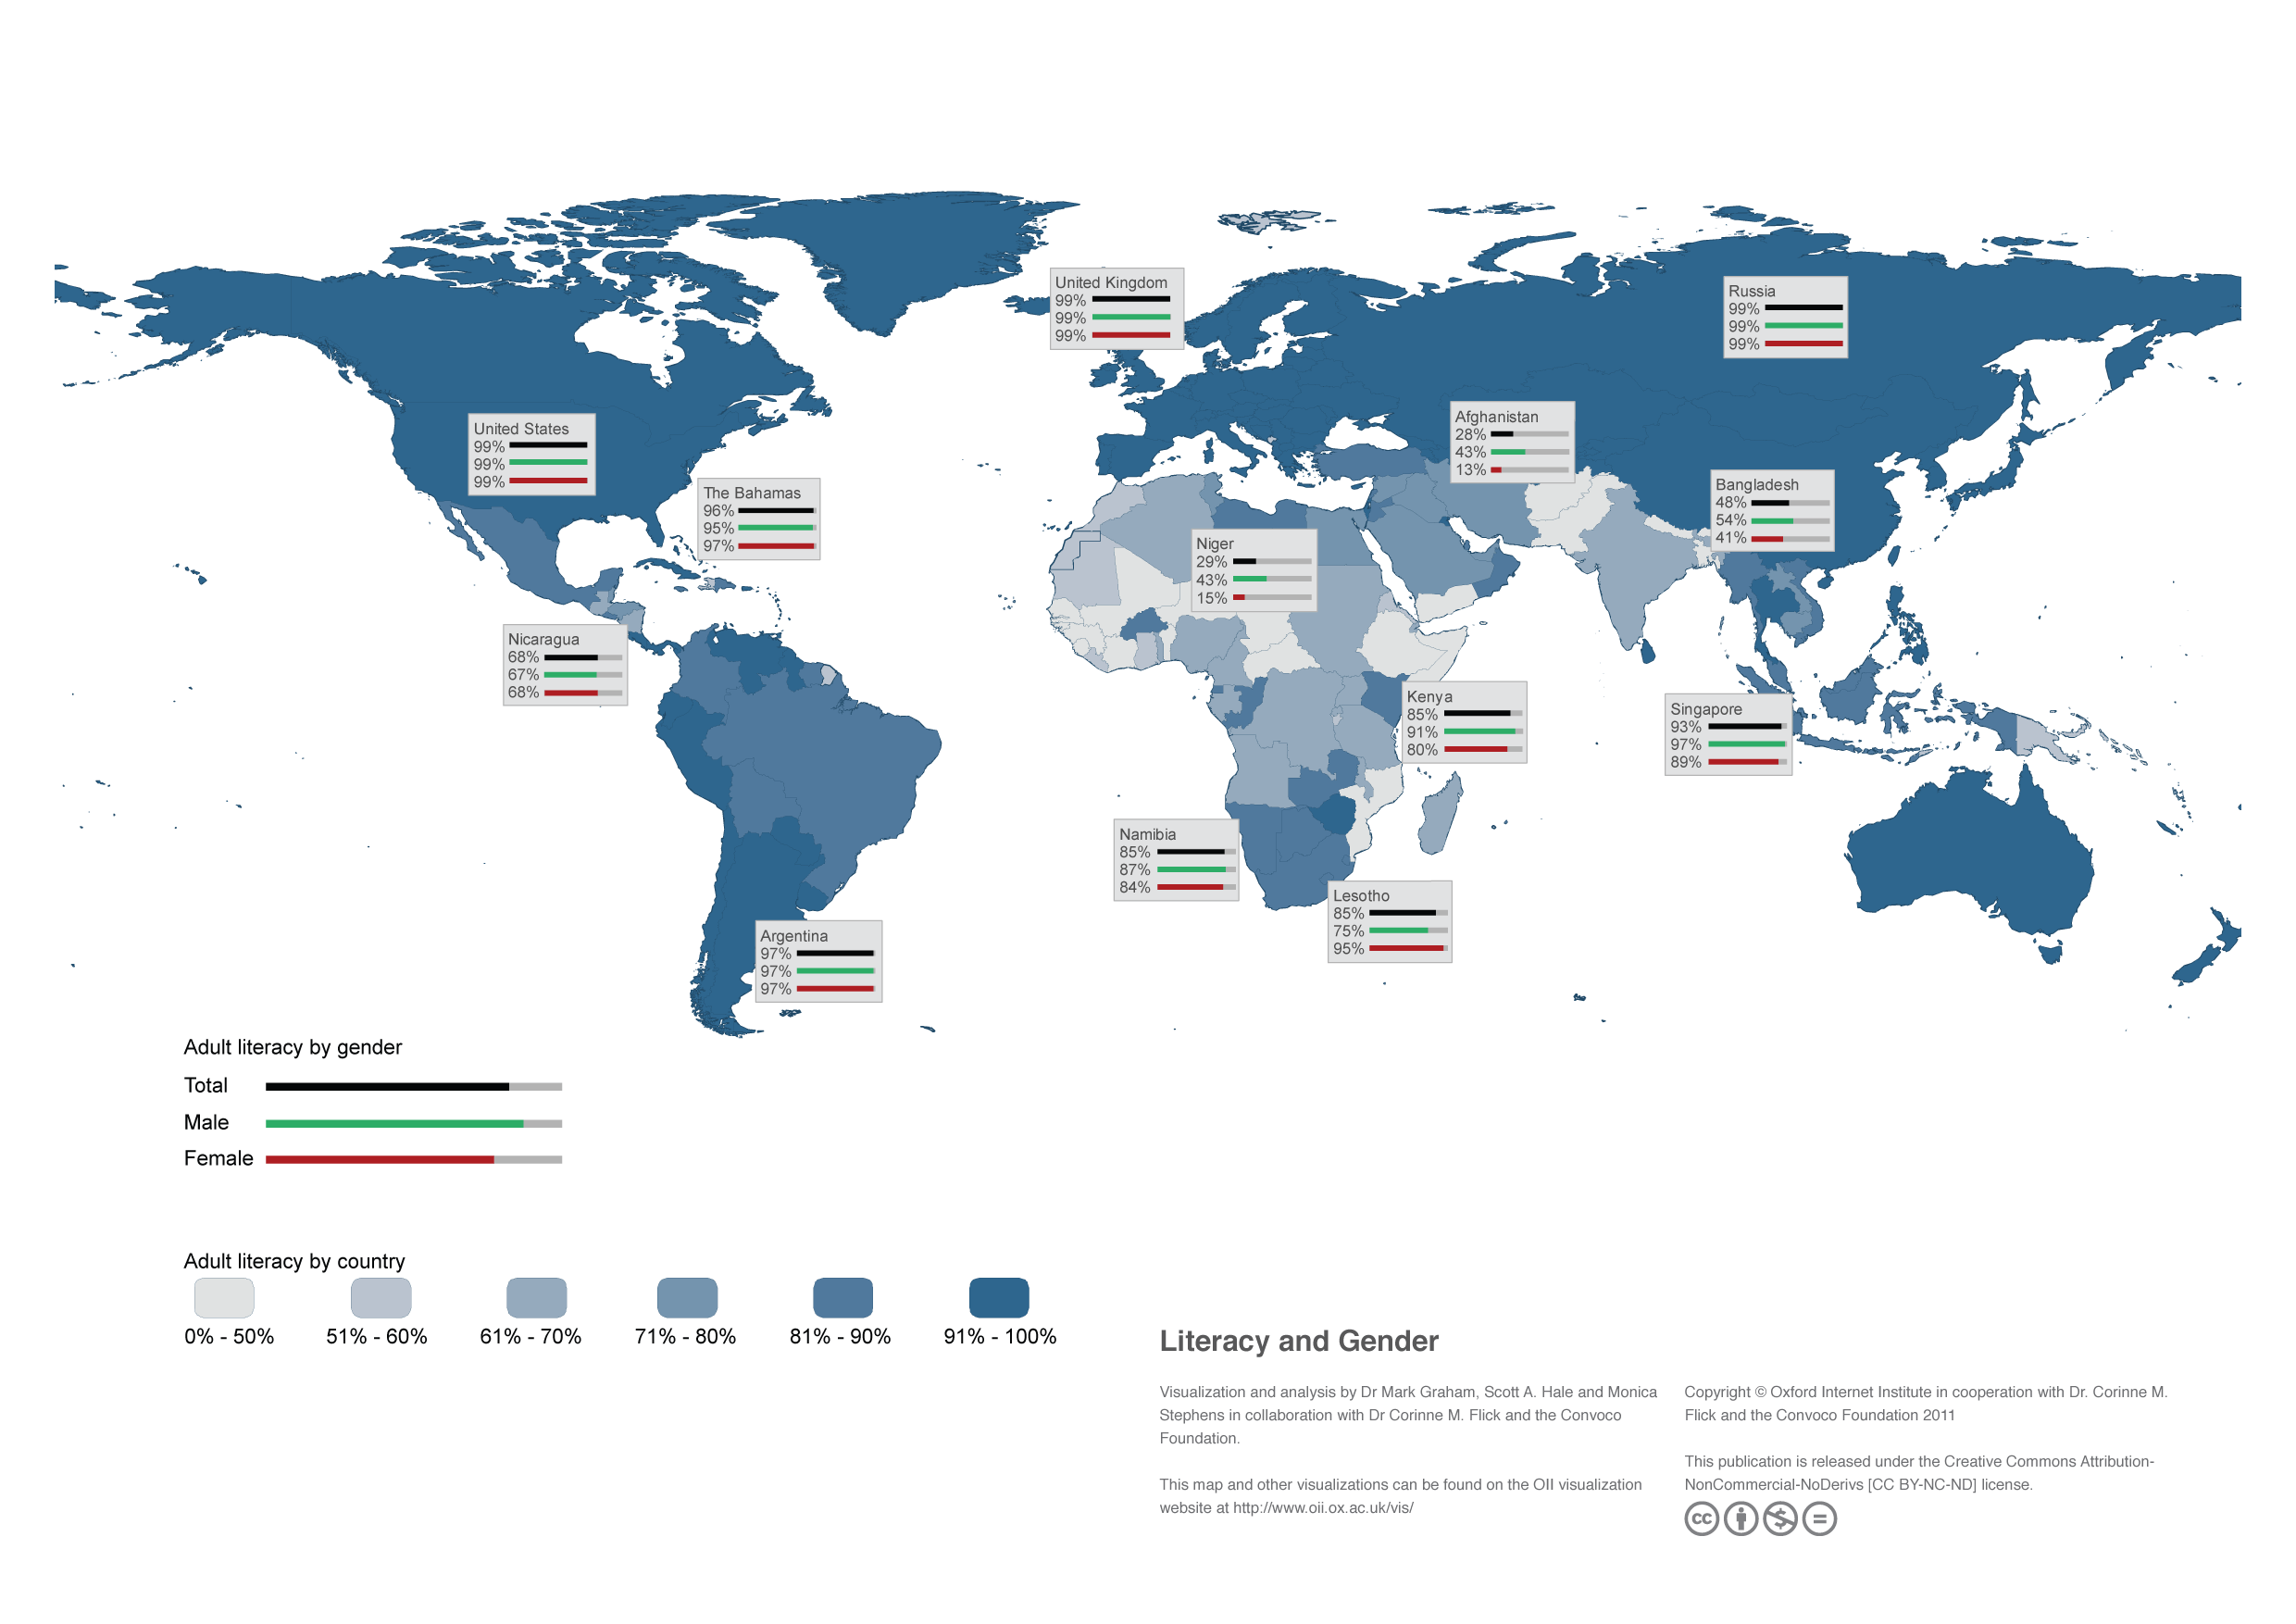
Literacy rate is defined as the number of people 15 years or older who can read and write. According to a study published by the Oxford Internet Institute at University of Oxford, global literacy rate is 82%. While the literacy rate for men is 87%, the rate for women is 77%.

Looking at data per continent, we find that countries in the Americas are highly literate, 99% for both men and women in the United States, and 97% for both men and women in Argentina. European countries show high literacy rates as well, above 91% for both men and women.

Many nations in Asia also show high literacy rates, except for countries like India, certain neighboring countries and countries in the Middle East, where the literacy rates are even lower for women.

Most African countries have very low literacy rates, with few exceptions: South Africa, Lesotho, Kenya, and Namibia.


Consumption of Spirits by Country

highest consumption of spiritsThe Economist compiled a visualization of the highest consumption of selected spirits worldwide. The selected spirits include vodka, rum, scotch whiskey, gin, and tequila.

The largest consumer of vodka is Russia, followed by the United States, Ukraine, Poland among others. The largest consumer of rum is India, followed by the United States, Philippines, and Cuba. The largest consumers of scotch whiskey, gin, and tequila are France, Philippines, and the United States respectively.


Gay Marriage by Country

gay marriage around the worldTo date, 15 countries allow gay marriage: Canada, Brazil, Argentina, Uruguay, Norway, Sweden, Denmark, Iceland, Netherlands, Belgium, France, Spain, Portugal, South Africa, and New Zealand.

Same-sex marriage is legal in some jurisdictions of Mexico and the United States. Currently, 12 states in the U.S. permit same-sex marriage, while 30 states have amended their constitutions to ban it.

Resource: Pew Research Center: A global snapshot of same-sex marriage


Wealth Comparison for the Years 1500 and 2015

wealth year 1500

wealth year 2015Comparing the levels of wealth per person for the years 1500 and 2015, as shown in these two maps, it is interesting to see how economic power has shifted from some nations to others.

Back in the 1500s, economic power was held by a majority of European nations leaded by Italy. China ranked number 23, India 53, and Japan 61. North America’s wealth was negligible compared to Europe’s, but the African region enjoyed more wealth than they do today.

A forecast for the year 2015 places Taiwan, Hong Kong, and Singapore at the top in GDP per capita. Some European nations are still wealthy, such is the case of Malta, Luxembourg, Norway, and Ireland, but Italy is not in the lead anymore. Japan’s wealth per capita has increased, and so has the United States’, but the wealth of African countries has become the lowest worldwide.

Source: Global Finance: Wealth Distribution and Income Inequality by Country


Global Attitudes About the Economy

global attitudes about the economyA survey conducted by the Pew Research Center in 39 nations, regarding attitudes about the state of the economy in the respondents’ respective countries, yielded interesting results.

Respondents in emerging economies are the most optimistic. A median of 53% believe their economy is doing well, specially in China and Malaysia. In contrast, respondents in developed economies are the most pessimistic. A median of only 24% say their economy is doing well. European nations such as Greece, Italy, Spain, and France are the most pessimistic of all.

In the case of developing economies, some are somewhat optimistic (Philippines and Bolivia), and other not so much (Tunisia and Lebanon).

Source: Pew Research Global Attitudes Project: Widespread Dissatisfaction with Economy

Read full report: Pew Research Global Attitudes Project: Economies of Emerging Markets Better Rated During Difficult Times


The Most and Least Racially Tolerant Countries

racial-tolerance-mapA survey conducted by two Swedish economists asked respondents in 80 countries what kind of people they would not like as neighbors, to which many replied “people of a different race”.

The results from that survey are displayed in this map published by the Washington Post. According to the survey, people in English-speaking, Scandinavian, and Latin American countries are the most racially tolerant, with the exception of Venezuela. South Africa shows to be a tolerant country, while the attitudes in Europe show a lot of variation. People in countries such as France, Turkey, India, Jordan, Saudi Arabia, Egypt, Nigeria, South Korea, and Indonesia are the least racially tolerant.


The 50 Largest Ports in the World

worlds 50 largest portsEvery day finished goods and commodities are transported  by sea in shipping containers from one port to another across the globe. Standard shipping containers measure 20 feet long by eight feet wide, hence they receive the name of “Twenty-foot Equivalent Units” or TEUs.

The largest port in the world is in Shanghai (China) which saw a volume of 31.74 million TEUs of cargo freight passing through its port in 2011. Shanghai is followed by Singapore (Singapore) which saw a volume of 29.94 million TEUs passing through its port for the same year. Singapore is followed by Hong Kong, Shenzhen (China), Busan (South Korea), Ningbo, Guangzhou, and Qingdao (China), Dubai Ports (United Arab Emirates), and Rotterdam (Netherlands), all in the top ten.

For the interactive map, that allows you to explore each one of the largest 50 ports in the world, visit: The Smithsonian: Interactive: The 50 Largest Ports in the World


Women in the Workforce by Country

women and equality worldIt has been said, that if women participated in the workforce more actively, like their male counterparts, the Gross Domestic Product (GDP) of those countries would be higher.

However, most countries, including some developed nations do not have policies in place that support women’s participation in the workforce, such as access to education, credit, employment, paid maternity leave or child care.

Countries with the highest economic success for women (measured in terms of equality of pay, degree of inclusion in the workforce, and career advancement), that offer the best policies for supporting women in the workforce include Norway, Australia, Sweden, Finland, Germany, Belgium, and Iceland.

Countries with the lowest degree of economic success that have few policies (or none) that support women in the workplace include Chad, Sudan, Yemen, Pakistan, Syria, Saudi Arabia, among others.

women and equality world 2Some interesting facts about the success of women in the workplace and the policies in place to support them in certain countries can be seen in the graphic above.

Source: Harvard Business Review: Vision Statement: Women and the Economics of Equality


Elimination of Chemical Weapons Worldwide

elimination of chemical weapons worldThe Organization for the Proliferation of Chemical Weapons (OPCW) was created to oversee the elimination of existing chemical weapons and monitor the chemical industry to prevent the production of additional chemical weapons. The OPCW was created in 1997 in The Hague, Netherlands, with support from the United Nations (UN).

The OPCW has 188 members states, signatories of the Chemical Weapons Convention (CWC). Nations that did not sign the CWC include Syria, Egypt, South Sudan, Somalia, Angola, and North Korea. Myanmar signed it, but it has not ratified it to date.

As of 2012, 71% of global stockpiles of chemical weapons have been destroyed, 46% of the total amount of chemical munitions have been eliminated, and 100% of the chemical plants producing chemical weapons have been decommissioned.

Source: Ria Novosti News Agency: Infographics – Elimination of Chemical Weapons in the World


Crude Oil Exports and Imports by Country

crude net balance by countryVast quantities of crude oil are exported and imported each year. Some countries are net exporters (their oil exports are larger than their oil imports), and some are net importers (their oil imports are larger than their exports).

In this visualization by Data Driven Consulting, we can see that the United States was the largest net importer of crude oil in 2009. Other net importer countries include China, India, Japan, South Korea, Germany, Belgium, Italy, UK, Spain, Singapore, and Australia.

Among the net exporters of crude oil we find Russia, Saudi Arabia, Iran, Iraq, Norway, Venezuela, Mexico, and Canada.

For the full-size interactive dashboard, visit: Tableau Public: Exporters and Importers