We now have a section dedicated to population pyramids. Find out all about the age structure of the population of every country in the world at https://www.indexmundi.com/population-pyramid/
We now have a section dedicated to population pyramids. Find out all about the age structure of the population of every country in the world at https://www.indexmundi.com/population-pyramid/
According to the 2019 United Nations World Population Prospects report, approximately 1,737 people die every day in Italy. In other words, a person dies in Italy approximately every 50 seconds. You can see a live clock keeping track of how many people have died today at https://www.indexmundi.com/clocks/indicator/deaths/italy. You can compare the number of deaths in Italy to the number of deaths in other countries at https://www.indexmundi.com/clocks/indicator/deaths.
Note that the numbers in this post were estimated without taking into account the effects of the coronavirus (COVID-19) pandemic. The net effect of the pandemic on the average number of daily deaths in Italy will not be clear until some time in the future. Today (April 4, 2020), 764 deaths were reported in Italy due to COVID-19, which is close to 44% of the normal number of daily deaths; however, it is possible that deaths due to other causes may have decreased because of widespread social distancing, quarantine, and stay-at-home measures. On the other hand, there may also be an increase in the number of deaths that could have been prevented if medical resources were not focused on COVID-19 patients. For more information about COVID-19 cases and deaths in Italy, visit our coronavirus information page for Italy.
If you are interested in the leading causes of death in Italy, check the Italy page at the Institute for Health Metrics and Evaluation.
According to the 2019 United Nations World Population Prospects report, approximately 26,670 people die every day in India. In other words, a person dies in India approximately every 3 seconds. You can see a live clock keeping track of how many people have died today at https://www.indexmundi.com/clocks/indicator/deaths/india. You can compare the number of deaths in India to the number of deaths in other countries at https://www.indexmundi.com/clocks/indicator/deaths.
If you are interested in the leading causes of death, check the India page at the Institute for Health Metrics and Evaluation.
According to the 2019 United Nations World Population Prospects report, approximately 27,765 people die every day in China. In other words, a person dies in China approximately every 3 seconds. You can see a live clock keeping track of how many people have died today at https://www.indexmundi.com/clocks/indicator/deaths/china. You can compare the number of deaths in China to the number of deaths in other countries at https://www.indexmundi.com/clocks/indicator/deaths.
If you are interested in the leading causes of death, check the China page at the Institute for Health Metrics and Evaluation.
According to the 2019 United Nations World Population Prospects report, approximately 779 people die every day in Canada. In other words, a person dies in Canada approximately every 110 seconds. You can see a live clock keeping track of how many people have died today at https://www.indexmundi.com/clocks/indicator/deaths/canada. You can compare the number of deaths in Canada to the number of deaths in other countries at https://www.indexmundi.com/clocks/indicator/deaths.
Note: The numbers in this post were estimated without taking into account the effects of the coronavirus (COVID-19) pandemic. The net effect of the pandemic on the average number of daily deaths in Canada will not be clear until some time in the future. Today (April 3, 2020), 29 deaths were reported in Canada due to COVID-19, which is close to 3.7% of the normal number of daily deaths; however, it is possible that deaths due to other causes may have decreased because of widespread social distancing, quarantine, and stay-at-home measures. On the other hand, there may also be an increase in the number of deaths that could have been prevented if medical resources were not focused on COVID-19 patients. For more information about COVID-19 cases and deaths in Canada, visit our coronavirus information page for Canada.
According to the United Nations World Population Prospects report, approximately 7,452 people die every day in the United States. In other words, a person dies in the US approximately every 12 seconds. You can see a live clock keeping track of how many people have died today at https://www.indexmundi.com/clocks/indicator/deaths/united-states. You can compare the number of deaths in the US to the number of deaths in other countries at https://www.indexmundi.com/clocks/indicator/deaths.
Note: The numbers in this post were estimated without taking into account the effects of the coronavirus (COVID-19) pandemic. The net effect of the pandemic on the average number of deaths in the US will not be clear until some time in the future. Today (December 10, 2020), 3124 deaths were reported due to COVID-19, which is close to 41.9% of the normal number of daily deaths; however, it is possible that deaths due to other causes may have decreased because of widespread social distancing, quarantine, and stay-at-home measures. On the other hand, there may also be an increase in the number of deaths that could have been prevented if medical resources were not focused on COVID-19 patients. For more information about COVID-19 cases and deaths in the US, visit our coronavirus section.
If you want to compare the total number of deaths in the US between 2020 and previous years, we recommend our US deaths dashboard.
According to the United Nations World Population Prospects report, a baby is born in the United States approximately every 8 seconds. You can keep track of how many babies have been born today by using our new US births clock at https://www.indexmundi.com/clocks/indicator/births/united-states. Compare the number of people born each day in the US to the numbers of other countries at https://www.indexmundi.com/clocks/indicator/births.
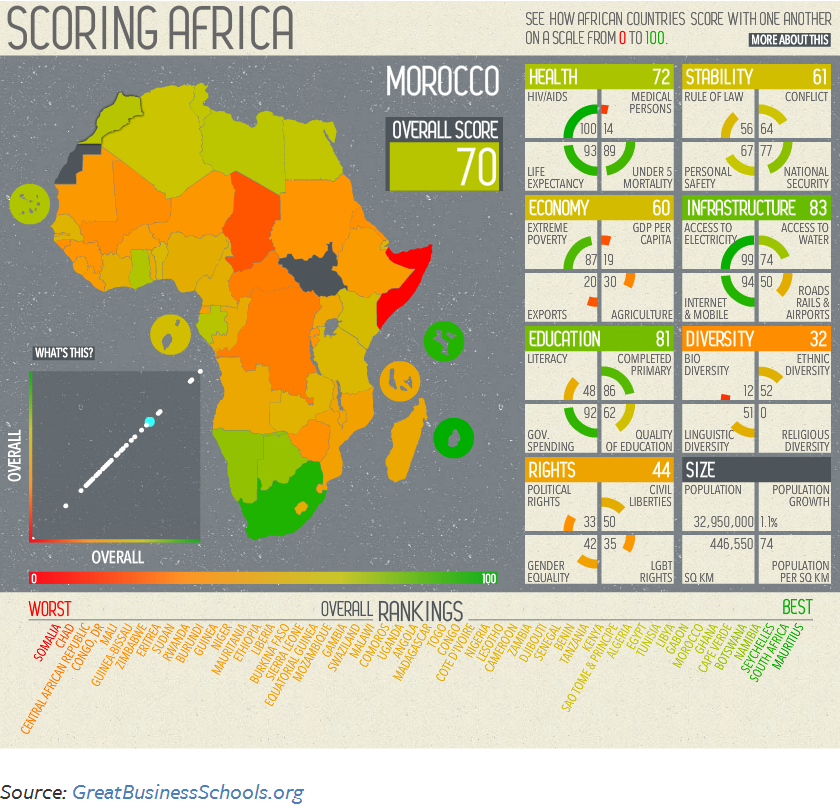
The African continent is home to 54 countries ranging from prosperous ones to countries that are plagued by violence and extreme poverty.
The chart above shows how African countries compare with one another, taking into account different indicators such as human rights, education, the state of the economy, political stability, the diversity and size of its population, and access to healthcare.
Countries with the highest score (best) include Mauritius, South Africa, and Seychelles. Countries with the lowest score (worst) include Somalia and Chad. In between these two extremes there are a wide range of countries performing well in some areas, and not so well in others.
Source: PolicyMic: This Awesome Interactive Map Will Make You Think Twice About Africa
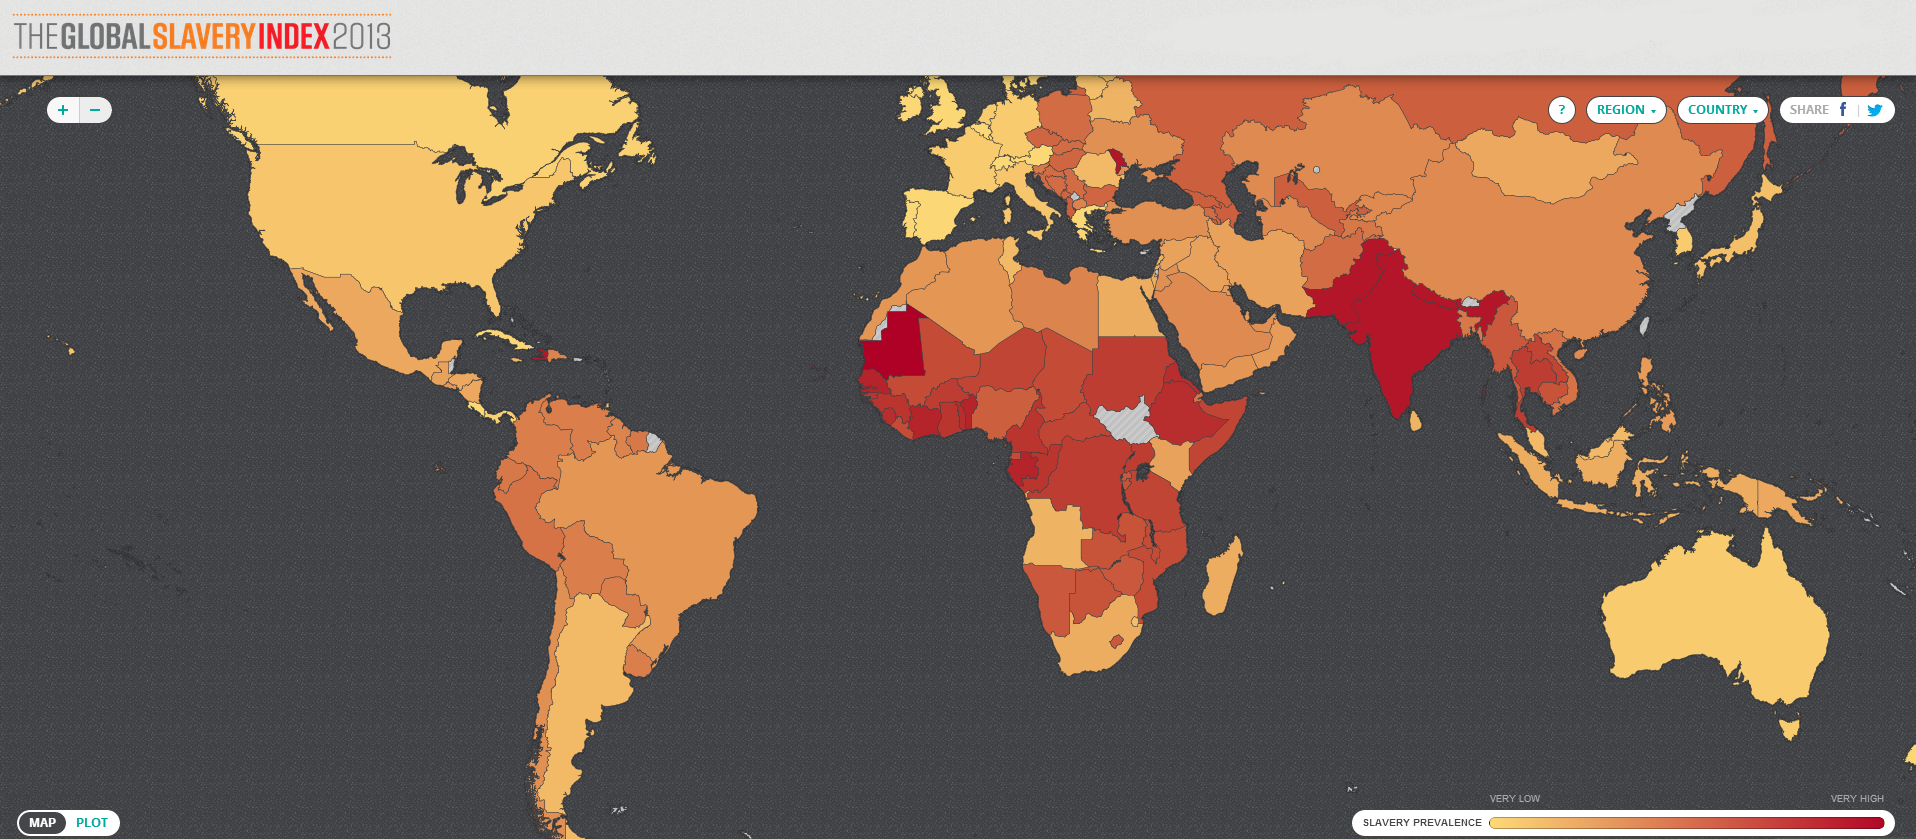
Slavery still exists in many parts of the world, whether it be in the form of forced labor, forced domestic servitude, sexual exploitation, debt bondage, bonded labor, or child marriage.
The Global Slavery Index provides insight into the number of people enslaved in 162 countries. The index takes into account three indicators: the prevalence of slavery per population, child marriage, and human trafficking.
India is a the top of the list with the largest absolute number of enslaved people, an estimated 14 million. China comes in second place with an estimated 2 million people enslaved. Pakistan is in third place with an estimated 2.1 million people in slavery. These countries are followed by Nigeria, Ethiopia, Russia, Thailand, Democratic Republic of Congo, Myanmar and Bangladesh. Put together, these countries account for 76% of the total enslaved people, or 29.8 million people, in the 162 countries that make up this ranking.
Source: Walk Free Foundation: The Global Slavery Index 2013
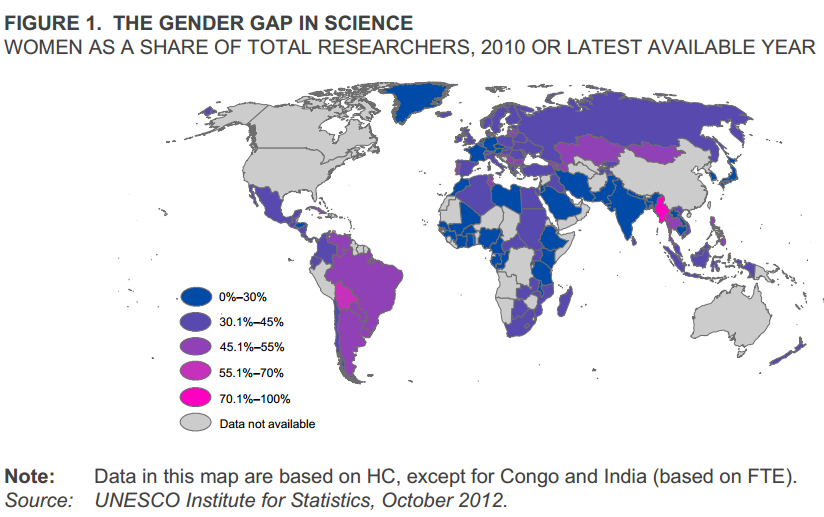
The number of women researchers is small compared to that of men globally. Researchers are professionals who are engaged in the creation of new knowledge, technologies, or products.
The map above shows the number of women as a share of total researchers by country. It is interesting to note that countries like Bolivia and Burma, both developing nations, show the highest ratio of female researchers compared to the total in each country. Since the data used here is based on headcounts of people employed in R&D full time and part time, I would take this results with caution considering that the total number of researches in these countries could be very low to begin with, and the results, therefore, not very solid.
In the same manner, the percentage of women researchers for Latin America and the Caribbean as a share of the total is the highest in the world, higher than the number for developed nations (45.2% according to this study) which seems counter-intuitive.
Source: UNESCO Institute of Statistics: Women in Science – The Gender Gap in Science