Category Archives: Rankings

Child Labor Index 2012

2011_A4_Map_Template_V03Child labor is a serious problem that affects children all around the world. The International Labor Organization (ILO) defines child labor as “work that deprives children of their childhood, their potential and their dignity, and that is harmful to physical and mental development.” According to ILO, an approximate 215 million children around the world are working. Out of this number, 115 million are thought to be doing dangerous work in hazardous conditions. An estimated 150 million children between ages 5 and 14 are subjected to child labor globally.

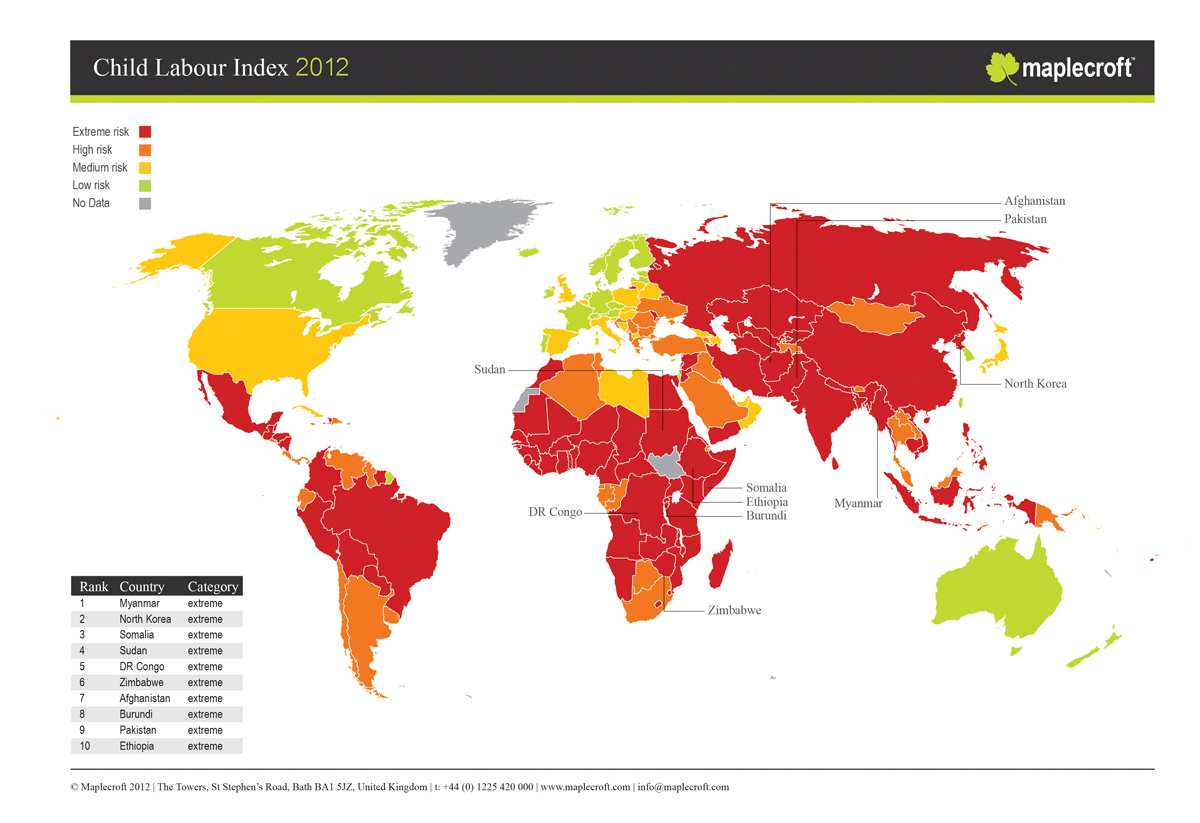
According to the Child Labor Index for 2012 published by risk analysis company Maplecroft, countries with the highest risk of child labor violations include Myanmar, North Korea, Somalia, Sudan, Afghanistan, Pakistan, Russia, India, and China among a group of 76 countries.

Read full report at: Maplecroft: Conflict and economic downturn cause global increase in reported child labour violations – 40% of countries now rated ‘extreme risk’


The United States vs. China

US and China compared - final graphicThe Guardian created this comparison of the U.S. and China, comparing several indicators such as GDP growth, GDP per capita, carbon emissions, exports, literacy rate, unemployment rate, military expenditure, outdoor pollution, to name a few.

The US is ahead of China in terms of literacy rate, number of internet users, military expenditure as a percentage of GDP, unemployment rate, GDP per capita, market capitalization, and social media. On the other hand, China is ahead of the U.S.  in terms of exports, GDP growth, number of people, carbon emission, and outdoor pollution.

While the U.S. has the largest deficit in its current account, China has the largest surplus.

Wealth Comparison for the Years 1500 and 2015

wealth year 1500

wealth year 2015Comparing the levels of wealth per person for the years 1500 and 2015, as shown in these two maps, it is interesting to see how economic power has shifted from some nations to others.

Back in the 1500s, economic power was held by a majority of European nations leaded by Italy. China ranked number 23, India 53, and Japan 61. North America’s wealth was negligible compared to Europe’s, but the African region enjoyed more wealth than they do today.

A forecast for the year 2015 places Taiwan, Hong Kong, and Singapore at the top in GDP per capita. Some European nations are still wealthy, such is the case of Malta, Luxembourg, Norway, and Ireland, but Italy is not in the lead anymore. Japan’s wealth per capita has increased, and so has the United States’, but the wealth of African countries has become the lowest worldwide.

Source: Global Finance: Wealth Distribution and Income Inequality by Country


World Production of Rare Earth Metals

the future global supply of rare earth elementsRare earth metals or rare earth elements are a collection of seventeen chemical elements located at the bottom of the periodic table. They are key elements in the manufacture of high technology components, hybrid cars, solar panels, lasers, electronics, etc.

As of 2010, China produced 97% of the total world production of rare earths, or 130,000 metric tons, followed by India (2%), Brazil (0.42%), and Malaysia (0.27%).

The estimated demand for rare earths for 2015 will increase 54% compared to the demand in 2010.

Source: GOOD: Infographic: The Future Global Supply of Rare Earth Elements

See also: IndexMundi: Commodities Glossary – Rare Earth Metals


Global Attitudes About the Economy

global attitudes about the economyA survey conducted by the Pew Research Center in 39 nations, regarding attitudes about the state of the economy in the respondents’ respective countries, yielded interesting results.

Respondents in emerging economies are the most optimistic. A median of 53% believe their economy is doing well, specially in China and Malaysia. In contrast, respondents in developed economies are the most pessimistic. A median of only 24% say their economy is doing well. European nations such as Greece, Italy, Spain, and France are the most pessimistic of all.

In the case of developing economies, some are somewhat optimistic (Philippines and Bolivia), and other not so much (Tunisia and Lebanon).

Source: Pew Research Global Attitudes Project: Widespread Dissatisfaction with Economy

Read full report: Pew Research Global Attitudes Project: Economies of Emerging Markets Better Rated During Difficult Times


The Most and Least Racially Tolerant Countries

racial-tolerance-mapA survey conducted by two Swedish economists asked respondents in 80 countries what kind of people they would not like as neighbors, to which many replied “people of a different race”.

The results from that survey are displayed in this map published by the Washington Post. According to the survey, people in English-speaking, Scandinavian, and Latin American countries are the most racially tolerant, with the exception of Venezuela. South Africa shows to be a tolerant country, while the attitudes in Europe show a lot of variation. People in countries such as France, Turkey, India, Jordan, Saudi Arabia, Egypt, Nigeria, South Korea, and Indonesia are the least racially tolerant.


Gasoline Spending by State in the U.S.

gas guzzlers mint finalMint.com tracked how much its users spend on gasoline in one month, and how many times they visit the pump in the same period across the United States.

On average, Americans spend $177 on gas in single month, making an average of 6 visits to the pump, and spending an average of $32 in each transaction.

San Jose (California) stands out as the city where Mint users spend the most on gas, an average of $216 in a single month. Other cities where Mint users spend a lot on gas include Birmingham (Alabama), Jacksonville (Florida), Phoenix (Arizona), and Charlotte (North Carolina) to name a few. In contrast, in cities like New York, Brooklyn (New York), and Washington D.C., which have a good public transportation system, the gas bill is between $102 and $112 per month.

Source: Mint: Gas Guzzlers


The 50 Largest Ports in the World

worlds 50 largest portsEvery day finished goods and commodities are transported  by sea in shipping containers from one port to another across the globe. Standard shipping containers measure 20 feet long by eight feet wide, hence they receive the name of “Twenty-foot Equivalent Units” or TEUs.

The largest port in the world is in Shanghai (China) which saw a volume of 31.74 million TEUs of cargo freight passing through its port in 2011. Shanghai is followed by Singapore (Singapore) which saw a volume of 29.94 million TEUs passing through its port for the same year. Singapore is followed by Hong Kong, Shenzhen (China), Busan (South Korea), Ningbo, Guangzhou, and Qingdao (China), Dubai Ports (United Arab Emirates), and Rotterdam (Netherlands), all in the top ten.

For the interactive map, that allows you to explore each one of the largest 50 ports in the world, visit: The Smithsonian: Interactive: The 50 Largest Ports in the World


Condom Imports by Country

One of our visitors asked us if we had statistics on condom imports so we started looking through our trade section and found the data somewhat hidden under the category “sheath contraceptives of vulcanised rubber”. Anyway, the graph below shows the top 25 countries ranked by the value of their condom imports. You may also want to check our data on condom exports. Are you surprised by the rankings?

Condom imports by country

Women in the Workforce by Country

women and equality worldIt has been said, that if women participated in the workforce more actively, like their male counterparts, the Gross Domestic Product (GDP) of those countries would be higher.

However, most countries, including some developed nations do not have policies in place that support women’s participation in the workforce, such as access to education, credit, employment, paid maternity leave or child care.

Countries with the highest economic success for women (measured in terms of equality of pay, degree of inclusion in the workforce, and career advancement), that offer the best policies for supporting women in the workforce include Norway, Australia, Sweden, Finland, Germany, Belgium, and Iceland.

Countries with the lowest degree of economic success that have few policies (or none) that support women in the workplace include Chad, Sudan, Yemen, Pakistan, Syria, Saudi Arabia, among others.

women and equality world 2Some interesting facts about the success of women in the workplace and the policies in place to support them in certain countries can be seen in the graphic above.

Source: Harvard Business Review: Vision Statement: Women and the Economics of Equality