Category Archives: United Kingdom

Basic Salary of Lawmakers by Country

basic salary of lawmakers by country 2013How much lawmakers are paid is a sensitive issue especially in times of economic austerity, or in countries where the majority of the population lives in extreme poverty conditions.

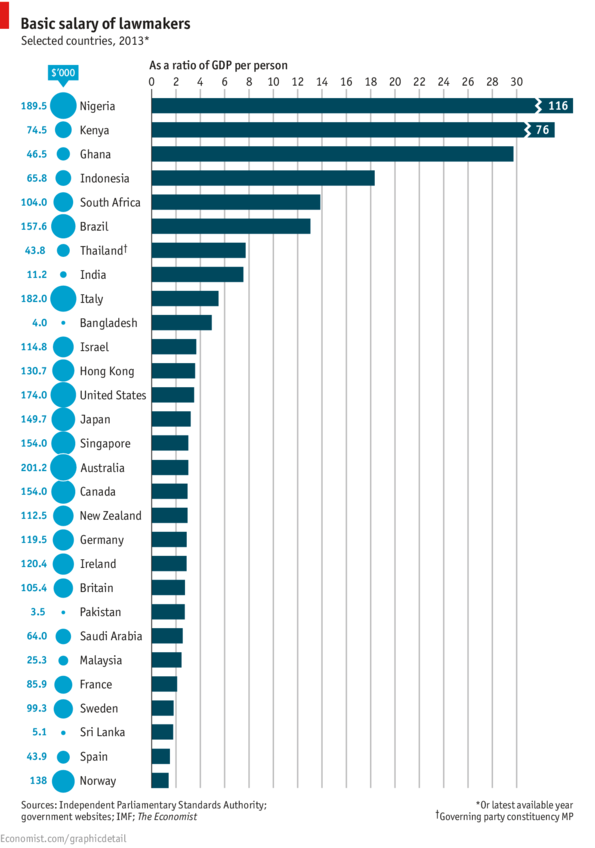
In this chart prepared by The Economist, we can see how much lawmakers are being paid in different countries across the globe in U.S. dollars (left), and as a ratio of the gross domestic product (GDP) per capita (right).

In Nigeria, for example, lawmakers receive a basic salary of $189,000, 116 times the country’s GDP per capita. In Kenya a lawmaker makes a basic salary of $74,500, 76 times the country’s GDP per capita. Other countries were lawmakers receive the heftiest salaries include Ghana, Indonesia, South Africa, Brazil, Thailand, and India. It is worth pointing out that most of these countries are some of the poorest in the world.

In comparison, in the wealthiest nations a lawmaker’s salary as a ratio of GDP is much smaller. In Britain, that ratio is 2.7 of the GDP per capita.


Global Carbon Footprint by Country

carbon footprint by countryThis original visualization by Stanford Kay shows total carbon emissions by country. Using different colors to differentiate each region, the size of the circle depicts the carbon footprint of each country.

Countries with the largest carbon footprint include China, United States, Russia, India, Japan, Germany, South Korea, Australia, UK, Iran, Saudi Arabia, Brazil, Taiwan, Ukraine, France, and Spain.


Extradition Treaties of the U.S. with Other Countries

american extradition treatiesAn estimated 100 countries have signed bilateral extradition treaties with the United States, including all Latin American countries, Western European countries, Egypt, India, Australia, and New Zealand to name a few. Some 60 nations including China, Russia, several Middle Eastern and African countries have not. However, even if some countries signed extradition treaties they can still refuse to hand an individual over to the U.S. if that person is seeking asylum or if he/she would face the death penalty.

Source: The Economist: Daily Chart: Where can he go?


Global Acceptance of Homosexuality

global homosexuality acceptanceIn light of the recent Supreme Court’s Defense of Marriage Act (DOMA) ruling in favor of same-sex marriage, we found this interesting visualization showing the global great divide among nations regarding the acceptance of homosexuality.

Countries where homosexuality is accepted include Spain (88%), Germany (87%), Czech Republic (80%) Canada (80%), Australia (79%), Philippines (73%), Argentina (74%), Italy (74%), Chile (68%), among others.

On the other side of the spectrum, there are countries where homosexuality is less acceptable, or not acceptable at all. Those countries include Nigeria (1%), Pakistan (2%), Tunisia (2%), Ghana (3%), Egypt (3%), Jordan (3%), Indonesia (3%), and Senegal (3%) to name a few.

Source: Pew Research Center: Global Acceptance of Homosexuality


Male and Female Literacy Rates by Country

global literacy ratesLiteracy rate is defined as the number of people 15 years or older who can read and write. According to a study published by the Oxford Internet Institute at University of Oxford, global literacy rate is 82%. While the literacy rate for men is 87%, the rate for women is 77%.

Looking at data per continent, we find that countries in the Americas are highly literate, 99% for both men and women in the United States, and 97% for both men and women in Argentina. European countries show high literacy rates as well, above 91% for both men and women.

Many nations in Asia also show high literacy rates, except for countries like India, certain neighboring countries and countries in the Middle East, where the literacy rates are even lower for women.

Most African countries have very low literacy rates, with few exceptions: South Africa, Lesotho, Kenya, and Namibia.


Global Attitudes About the Economy

global attitudes about the economyA survey conducted by the Pew Research Center in 39 nations, regarding attitudes about the state of the economy in the respondents’ respective countries, yielded interesting results.

Respondents in emerging economies are the most optimistic. A median of 53% believe their economy is doing well, specially in China and Malaysia. In contrast, respondents in developed economies are the most pessimistic. A median of only 24% say their economy is doing well. European nations such as Greece, Italy, Spain, and France are the most pessimistic of all.

In the case of developing economies, some are somewhat optimistic (Philippines and Bolivia), and other not so much (Tunisia and Lebanon).

Source: Pew Research Global Attitudes Project: Widespread Dissatisfaction with Economy

Read full report: Pew Research Global Attitudes Project: Economies of Emerging Markets Better Rated During Difficult Times


The Most and Least Racially Tolerant Countries

racial-tolerance-mapA survey conducted by two Swedish economists asked respondents in 80 countries what kind of people they would not like as neighbors, to which many replied “people of a different race”.

The results from that survey are displayed in this map published by the Washington Post. According to the survey, people in English-speaking, Scandinavian, and Latin American countries are the most racially tolerant, with the exception of Venezuela. South Africa shows to be a tolerant country, while the attitudes in Europe show a lot of variation. People in countries such as France, Turkey, India, Jordan, Saudi Arabia, Egypt, Nigeria, South Korea, and Indonesia are the least racially tolerant.


The 50 Largest Ports in the World

worlds 50 largest portsEvery day finished goods and commodities are transported  by sea in shipping containers from one port to another across the globe. Standard shipping containers measure 20 feet long by eight feet wide, hence they receive the name of “Twenty-foot Equivalent Units” or TEUs.

The largest port in the world is in Shanghai (China) which saw a volume of 31.74 million TEUs of cargo freight passing through its port in 2011. Shanghai is followed by Singapore (Singapore) which saw a volume of 29.94 million TEUs passing through its port for the same year. Singapore is followed by Hong Kong, Shenzhen (China), Busan (South Korea), Ningbo, Guangzhou, and Qingdao (China), Dubai Ports (United Arab Emirates), and Rotterdam (Netherlands), all in the top ten.

For the interactive map, that allows you to explore each one of the largest 50 ports in the world, visit: The Smithsonian: Interactive: The 50 Largest Ports in the World


Elimination of Chemical Weapons Worldwide

elimination of chemical weapons worldThe Organization for the Proliferation of Chemical Weapons (OPCW) was created to oversee the elimination of existing chemical weapons and monitor the chemical industry to prevent the production of additional chemical weapons. The OPCW was created in 1997 in The Hague, Netherlands, with support from the United Nations (UN).

The OPCW has 188 members states, signatories of the Chemical Weapons Convention (CWC). Nations that did not sign the CWC include Syria, Egypt, South Sudan, Somalia, Angola, and North Korea. Myanmar signed it, but it has not ratified it to date.

As of 2012, 71% of global stockpiles of chemical weapons have been destroyed, 46% of the total amount of chemical munitions have been eliminated, and 100% of the chemical plants producing chemical weapons have been decommissioned.

Source: Ria Novosti News Agency: Infographics – Elimination of Chemical Weapons in the World


Crude Oil Exports and Imports by Country

crude net balance by countryVast quantities of crude oil are exported and imported each year. Some countries are net exporters (their oil exports are larger than their oil imports), and some are net importers (their oil imports are larger than their exports).

In this visualization by Data Driven Consulting, we can see that the United States was the largest net importer of crude oil in 2009. Other net importer countries include China, India, Japan, South Korea, Germany, Belgium, Italy, UK, Spain, Singapore, and Australia.

Among the net exporters of crude oil we find Russia, Saudi Arabia, Iran, Iraq, Norway, Venezuela, Mexico, and Canada.

For the full-size interactive dashboard, visit: Tableau Public: Exporters and Importers