Category Archives: Charts

U.S. Mobile Phone Subscribers Talk the Most

americans and the mobile phoneOn average, U.S. mobile subscribers talk on the phone 356 minutes, or roughly 6 hours per month. That number is double that of the Turkey, and 4.5 times that of Germany. That estimate is the highest among selected OECD countries.

Canadians are not far behind. The outgoing traffic per mobile subscriber is an average 345 minutes (5 hours and 45 minutes) in a single month.

 Source: Statista: Americans Talk on Their Mobile Phones More Than Anyone Else


Basic Salary of Lawmakers by Country

basic salary of lawmakers by country 2013How much lawmakers are paid is a sensitive issue especially in times of economic austerity, or in countries where the majority of the population lives in extreme poverty conditions.

In this chart prepared by The Economist, we can see how much lawmakers are being paid in different countries across the globe in U.S. dollars (left), and as a ratio of the gross domestic product (GDP) per capita (right).

In Nigeria, for example, lawmakers receive a basic salary of $189,000, 116 times the country’s GDP per capita. In Kenya a lawmaker makes a basic salary of $74,500, 76 times the country’s GDP per capita. Other countries were lawmakers receive the heftiest salaries include Ghana, Indonesia, South Africa, Brazil, Thailand, and India. It is worth pointing out that most of these countries are some of the poorest in the world.

In comparison, in the wealthiest nations a lawmaker’s salary as a ratio of GDP is much smaller. In Britain, that ratio is 2.7 of the GDP per capita.


Violence Against Women by World Region

violence against womenIn this chart published by The Economist we look at two sets of data about violence against women.

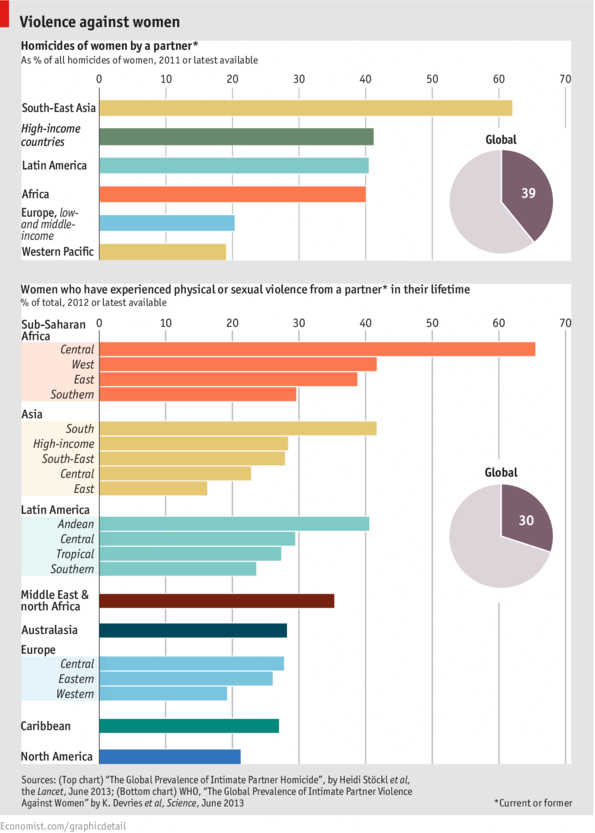
The first one shows that more than a third (39%) of homicides of women around the world are committed by a previous or current partner. The numbers are specially shocking for South East Asia (Cambodia, Laos, Myanmar [Burma], Thailand, Vietnam, Brunei, Malaysia, East Timor, Indonesia, Philippines, and Singapore). The numbers are also high for Latin American and African countries.

The second set of data shows that 30% of women around the world have experienced physical or sexual violence during their lifetime by a former or current partner. The numbers are the highest for Central African countries (Burundi, Central African Republic, Democratic Republic of the Congo, and Rwanda),  followed by countries in West Africa (Benin, Burkina Faso, Ivory Coast, Ghana, Liberia, Nigeria, Senegal, Sierra Leone, etc.), South Asia (Afghanistan, Bangladesh, Bhutan, India, Maldives, Nepal, Pakistan, and Sri Lanka), the Andean region of South America (Colombia, Venezuela, Ecuador, Peru, and Bolivia), the Middle East, and North Africa.
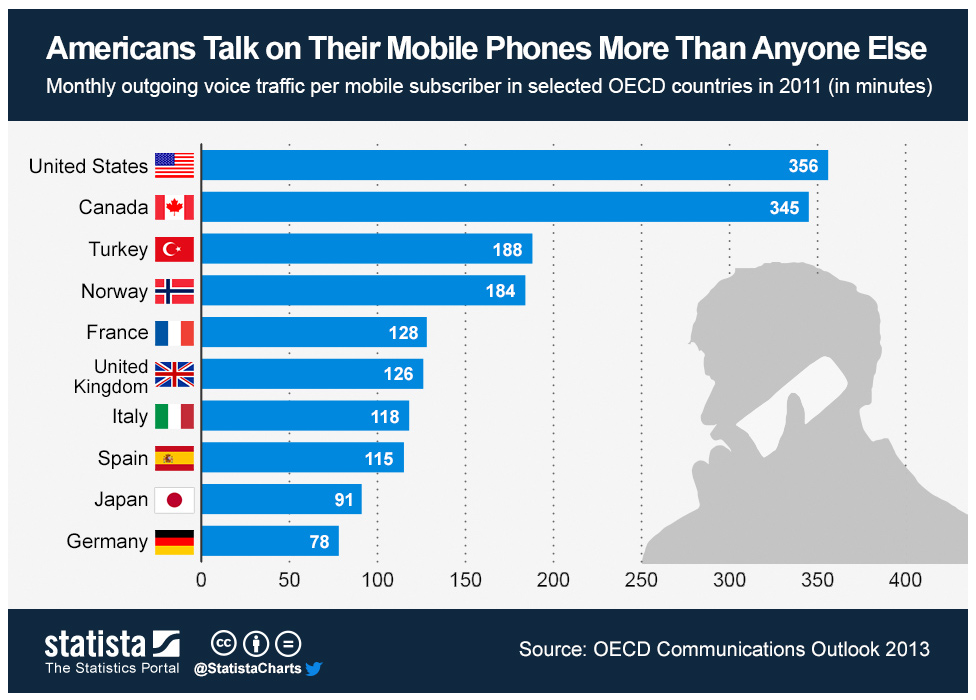
 

World Population Growth Over Time

population growth over time 1800-2050

World population growth accelerated in the last century. During the twentieth century alone, the number of people increased from 1.5 billion to 6 billion.

In the year 1800 the world’s population had reached 1 billion, with most people living in Asia and Europe. By 1927, 127 years later, the population of the world had doubled, reaching an staggering 2 billion people.

population growth over time 1927Population growth remained almost the same until 1950 when advances in science and medicine increased life expectancy, specially in developed nations.

The world’s population reached 3 billion inhabitants by 1960, 4 billion by 1974, 5 billion by 1987, 6 billion by 1999, 7 billion by 2011.

population growth over time 2050It is estimated that the population of the world will reach 8 billion by 2024, and 9 billion by 2050. Most of the growth will occur in developing nations

Source: NOVA: Human Numbers Through Time


Global Carbon Footprint by Country

carbon footprint by countryThis original visualization by Stanford Kay shows total carbon emissions by country. Using different colors to differentiate each region, the size of the circle depicts the carbon footprint of each country.

Countries with the largest carbon footprint include China, United States, Russia, India, Japan, Germany, South Korea, Australia, UK, Iran, Saudi Arabia, Brazil, Taiwan, Ukraine, France, and Spain.


The Effect of Immunizations on Infectious Diseases

inmunization in1900 and 2010Vaccinations have helped decrease the number of cases of infectious diseases in the last 110 years.

The bubble chart on the left shows the number of cases of infectious diseases in the United States in the 1900s. Even though diseases like measles, pertussis, mumps, and rubella that used to infect hundreds of thousands of people have not disappeared, nowadays they infect a much lower number of people thanks to the use of vaccines, as shown on the bubble chart on the right.

Source: Vaccines.com


Consumption of Spirits by Country

highest consumption of spiritsThe Economist compiled a visualization of the highest consumption of selected spirits worldwide. The selected spirits include vodka, rum, scotch whiskey, gin, and tequila.

The largest consumer of vodka is Russia, followed by the United States, Ukraine, Poland among others. The largest consumer of rum is India, followed by the United States, Philippines, and Cuba. The largest consumers of scotch whiskey, gin, and tequila are France, Philippines, and the United States respectively.


The United States vs. China

US and China compared - final graphicThe Guardian created this comparison of the U.S. and China, comparing several indicators such as GDP growth, GDP per capita, carbon emissions, exports, literacy rate, unemployment rate, military expenditure, outdoor pollution, to name a few.

The US is ahead of China in terms of literacy rate, number of internet users, military expenditure as a percentage of GDP, unemployment rate, GDP per capita, market capitalization, and social media. On the other hand, China is ahead of the U.S.  in terms of exports, GDP growth, number of people, carbon emission, and outdoor pollution.

While the U.S. has the largest deficit in its current account, China has the largest surplus.

Economic and Human Impact of Natural Disasters

economic and human impact of disastersThis visualization by the United Nations Office of Disaster Risk Reduction (UNISDR) shows the impact of natural disasters in the period 2000-2012.

Between 2009 and 2011 the economic cost of disasters increased from $50 billion to $371 billion due to the 2011 Great East Japanese Earthquake. The largest number of people killed occurred in the period 2009-2010, mainly due to earthquakes, including the 2010 Haiti earthquake. The largest number of people affected in the last twelve years occurred between 2001 and 2002, mainly due to droughts, including droughts in China and India.

Source: United Nations on Tumbler


World Production of Rare Earth Metals

the future global supply of rare earth elementsRare earth metals or rare earth elements are a collection of seventeen chemical elements located at the bottom of the periodic table. They are key elements in the manufacture of high technology components, hybrid cars, solar panels, lasers, electronics, etc.

As of 2010, China produced 97% of the total world production of rare earths, or 130,000 metric tons, followed by India (2%), Brazil (0.42%), and Malaysia (0.27%).

The estimated demand for rare earths for 2015 will increase 54% compared to the demand in 2010.

Source: GOOD: Infographic: The Future Global Supply of Rare Earth Elements

See also: IndexMundi: Commodities Glossary – Rare Earth Metals