Category Archives: Chile

Drought Severity by Country (1901 – 2008)

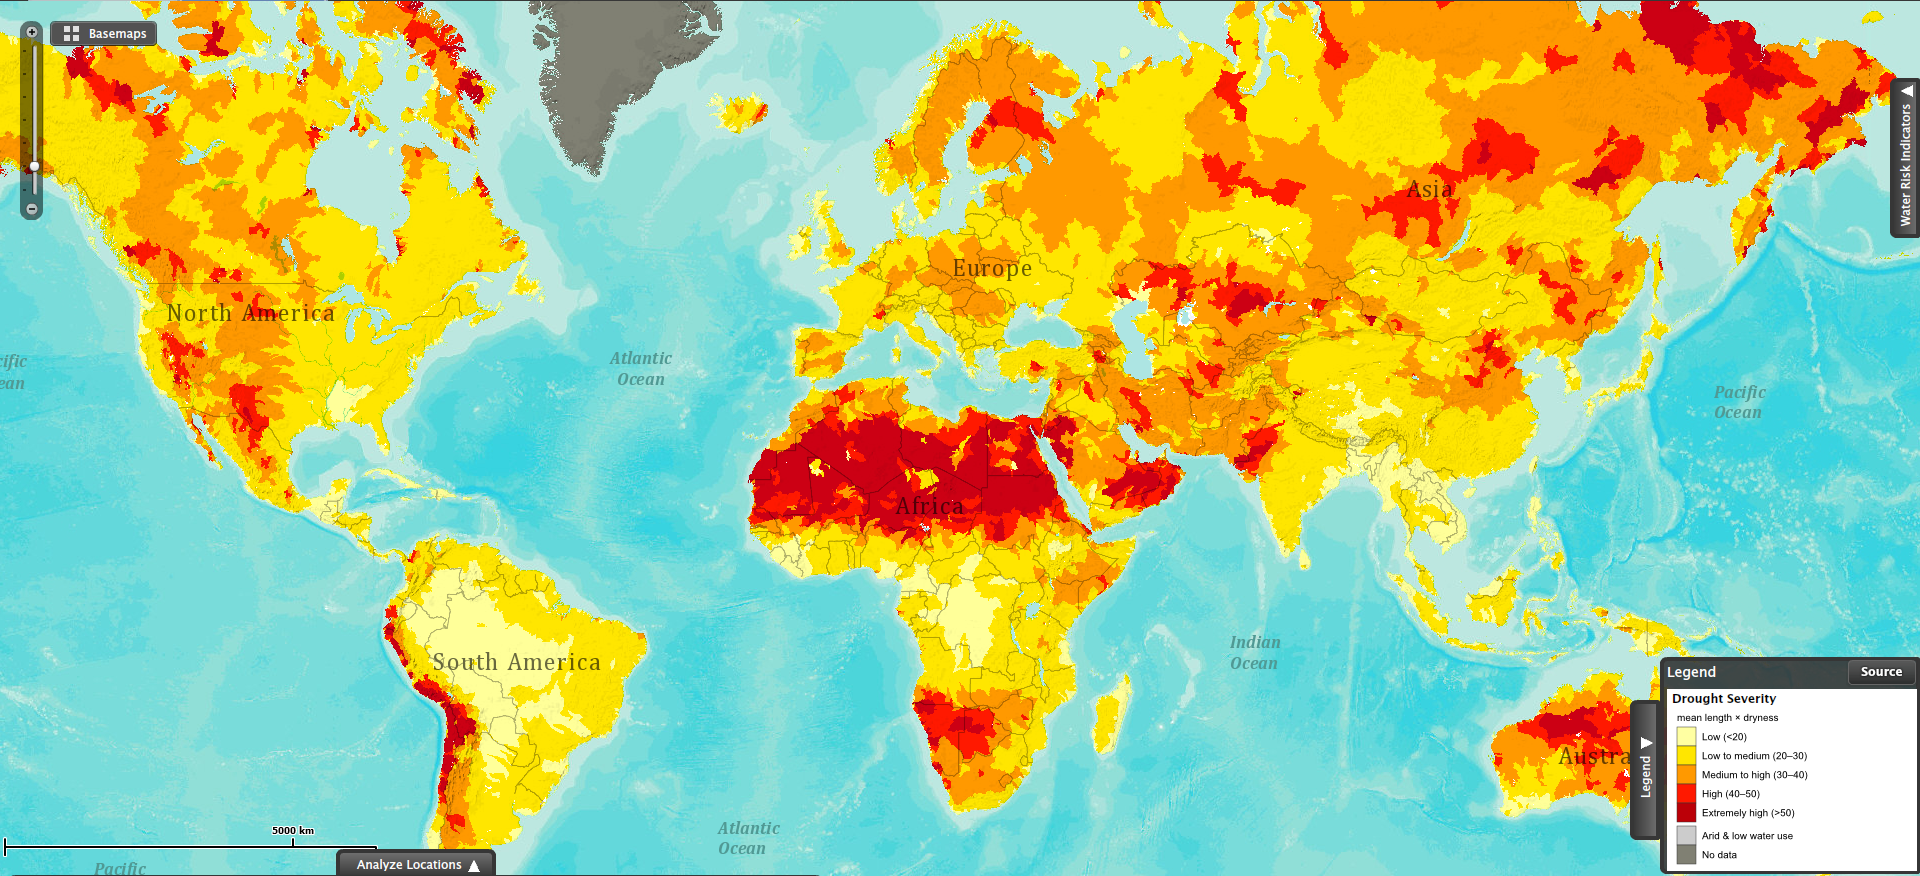
drought severity worldThis map shows drought severity, measured as the product of the average length of a drought occurrence and how dry it was the drought. This visualization is based on data collected for the period between 1901 and 2008.

The red areas in the map show the regions most severely affected by droughts. The northern region of the African continent stands out as the largest area being affected by severe droughts. Southwestern Africa (Namibia and Botswana) has also been severely affected by droughts in the same period.

Some areas in the Andean region in South America (Ecuador, Peru, Bolivia, Chile and Argentina) have also suffered the effects of severe droughts during the past century.

Parts of Australia and Russia have also been affected by extreme drought conditions.

Sources:


Body Mass Index (BMI) by Country

A body mass index (BMI) between 18.5 and 24.9 is usually considered a healthy body weight to height relationship. A BMI of 25 or higher indicates body weight not optimal for the height of a particular person.

This visualization published by Visual.ly, shows the different BMI values for adult men and women across the globe.

Countries with a healthy average BMI between 20 and 22.9 include several nations in Africa, Yemen, India, Thailand, Japan, Pakistan, Singapore, among others.

Countries with an average BMI between 23 and 24.9 include several Asian nations, several European nations (including France), some nations in Africa, and Honduras.

Countries with an average BMI between 25 and 26.9 include Canada, Russia, Costa Rica, Colombia, Israel, Austria, Switzerland, Brazil, all Nordic countries, Spain, Portugal, and nations in the Middle East.

Countries with an average BMI of 27 and over  (the highest BMI range) include the United States, Kuwait, Cuba, Argentina, Chile, Bolivia, Peru, Venezuela, Australia, UK, New Zealand, Greece, and Germany to name a few.


Life Expectancy at Birth for Women

Life expectancy at birth, for women, varies significantly across the world.

On one side of the spectrum, we find nations where the life expectancy at birth for females is 80.5 years or more. Countries in this group include the United States, Canada, Chile, several developed nations in Northern, Southern and Eastern Europe, Australia, New Zealand, Japan, and South Korea.

On the other side, we find nations where the life expectancy at birth for females is much lower, 62.0 years or less. This group is comprised by the majority of African countries, with the exception of North African nations, and Afghanistan.

Resource: The World Bank DataBank: Gender Statistics – Life expectancy at birth, female (years)


Chilean Peso US Dollar Exchange Rate

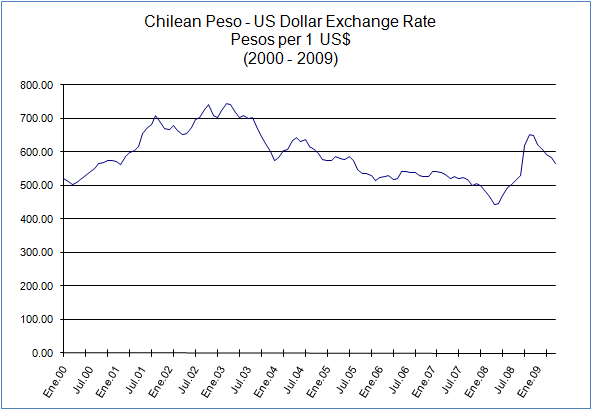
The chart below shows the exchange rate of the Chilean peso with respect to the US dollar since January of 2000. Between February 2003 and February 2008, the value of the Chilean peso appreciated with respect to the US dollar. That trend reversed into depreciation starting March 2008. Since November 2008, the Chilean peso started to appreciate again against the US dollar.

Chilean Peso US Dollar Exchange Rate

Source: Banco Central de Chile

Tipo de Cambio Peso Chileno Dólar

El siguiente gráfico muestra el tipo de cambio del peso chileno con respecto al dólar americano desde enero del 2000. Entre febrero del 2003 y febrero del 2008, el peso chileno mantuvo una tendencia a apreciarse con respecto al dólar americano. A partir de marzo del 2008 esa tendencia se revirtió y el peso chileno empezó a depreciarse con respecto al dólar. Desde noviembre del 2008, el peso chileno empezó a apreciarse nuevamente.

Tipo de Cambio Peso Chileno Dólar

Fuente: Banco Central de Chile