Category Archives: Topics

Real-Time Twitter Activity Mapped

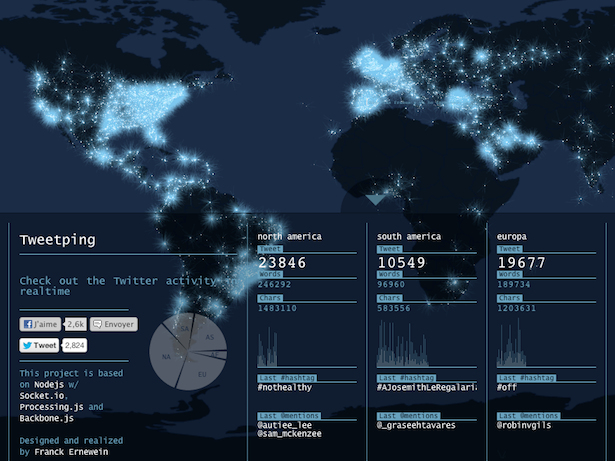
This visualization from Tweetping.net shows Twitter activity in real time, worldwide. Using Twitter’s API, Tweetping.net tracks the total number of tweets, including word and character count, generated per second. It also tracks the latest mentions and hashtags used, categorized by region. The lit areas show where Twitter activity is happening at the moment.

For more, visit: The Atlantic: What Twitter Really Looks Like


Chicago: A City of Guns

click to enlargeChicago is the only city in the United States with tough gun control laws. Gun shops are prohibited, and so are shootings ranges. It is illegal for private citizens to carry guns in public places. Despite this fact, Chicago has experienced a high number of gun-related deaths, 500 homicides in 2012 and so far 40 in the first month of 2013.

Guns recovered by the Chicago police in the last twelve years came mainly from the within the state of Illinois, followed by the states of Indiana, Mississippi, Wisconsin, Kentucky, Ohio, Tennessee, Alabama, Arkansas and Texas. Overall, the provenance of guns confiscated in Chicago pointed to all 50 states, Puerto Rico and Guam.

Resource: The New York Times: Where 50,000 Guns Recovered in Chicago Came From


Military Spending Worldwide

According to an article of The Guardian, in 2008 the defense budget of the United States was $607 billion, ten times that of China and the UK, fifteen times that of Germany, seventeen times that of Russia, and twenty five times that of India. In fact, the defense budget of the top nine countries combined (shown in the first graphic) adds up to $377 billion, or 62% of the military spending of the U.S. Those numbers would make the U.S. the top country in defense spending in the world.

But, if one looks at defense spending numbers as a percentage of the GDP, we have a different story. In that case, Myanmar becomes the top defense spender with a military budget of 26% of its GDP, followed by Jordan, Georgia and Saudi Arabia. The U.S. moves to number eight, with a military budget of 4% of its GDP. Large military spending by these nations is due to different factors. Some of these countries are dictatorships, some are monarchies. Others need to actively protect their borders from foreign aggression.

To read the article from The Guardian, visit: The Guardian: Data Store – Show and Tell, Information is beautiful: war games


Trafficking of Females

trafficking of females

Although statistics about trafficking of females are unreliable due to a number of reasons, starting with the clandestine nature of the activity, the WomanStats Project has managed to gather one of the most comprehensive data sets to date about the issue. One of the maps they produced, displayed above, illustrates the magnitude of the problem worldwide. You may find it shocking that in this day and age trafficking is not illegal and is even common in several countries, including Egypt, Sudan, Saudi Arabia, and Iran. To find out more about the issue, and find out what you can do to help, visit the Stop Violence Against Women site.

The Gun Lobby in the U.S.

While the debate goes on in Congress regarding gun control, it is interesting to see that many members of Congress that will be voting on the issue, received donations from no other than the National Rifle Association (NRA). On the graphic above, compiled by the Washington Post, we can see that the party that benefited the most from NRA donations in 2012 was the Republican party.

Recipients of NRA donations are selected by the NRA based on a grading system that includes how a particular Congress member supported the NRA on gun issues in the past.

For the interactive graphic that allows you to check for names of candidates that received financial contributions by the NRA visit: The Washington Post: How the NRA exerts influence over Congress


Record Warm Temperatures Registered in 2012

click to enlarge

Temperatures for the U.S. contiguous states in 2012 were 1 degree Fahrenheit warmer than the previous record temperatures of 1998. Based on preliminary data the National Oceanic and Atmospheric Administration (NOOA) created the map above, where it can be clearly seen that across the nation warmer temperatures were registered. Nineteen states from Massachusetts to Utah, experienced record warmer temperatures.

2012 was also a year of record low levels of precipitation, below average. Drier than average conditions affected the central parts of the United States, with negative consequences for agriculture. The winter season 2011-2012 was affected by higher than normal warm temperatures as well.


It Is Flu Time!

Right now it is flu season in the northern hemisphere. The flu (influenza) is a contagious respiratory disease caused by influenza viruses.

Google Trends created the map shown above, based on aggregate data generated by users searching for the word “flu” and related terms, in order to estimate flu activity worldwide. According to data captured by Google Trends, flu activity is very intense in the U.S. at the moment. Canada, Russia, Norway, Poland, the Netherlands and Japan show high flu activity as well.


The Centers for Disease Control and Prevention (CDC) tracks the geographical spread of flu across the United States, however, the collected data does not reflect intensity of influenza activity.

As can be seen in the map, the flu has spread relatively quickly in the last three weeks throughout the continental United States. California, Mississippi and the District of Columbia show local influenza activity at the moment.


We Live Longer

click to enlarge

Average global life expectancy is now 70.4 years; 73.3 for women and 67.5 for men.

Life expectancy has gone up significantly in places like Iran, Bangladesh, the Maldives, South America and Africa, where the increase has been of 13 years or more, compared to previous decades. North America, Western Europe and Australasia have seen a modest increase of 7 plus years.

The rise in life expectancy has been possible thanks to the improvement in health programs and the control/cure of many infectious diseases that ended up in death, especially in young children.

But, there are places where the rise has been negligible like Eastern Europe, with an average increase of just 1 year. Other places have even experienced a decline in life expectancy. Such is the case of Lesotho and Belarus, which have seen a rise in HIV and alcoholism, respectively.

According to a report published by The Lancet, although we live longer now, the quality of life has declined due to the rise in obesity and its consequences: diabetes, high blood pressure and heart conditions.

Resources:


World Leaders on Twitter

click to enlarge

Heads of state have realized the importance of being active in social media. The number of heads of state with Twitter accounts increased 78% in 2012 with respect to 2011, according to a report by the Digital Policy Council. Roughly 75% of them have Twitter accounts. According to a Washington Post article, world leaders that tweet more come from countries that have a tradition of transparency. 63% of the them come from “politically stable” countries.

President Barack Obama (@BarackObama) has the largest number of followers on Twitter for a head of state, with more than 25 million followers. In second place comes Venezuelan president Hugo Chavez (@chavezcandanga) with 3.8 million followers. Turkish president Abdullah Gül (@cbabdullahgul) comes in third place with 2.6 million followers, and Queen Rania of Jordan (@QueenRania) is fourth with 2.5 million followers. Russian prime minister Dmitry Medvedev (@MedvedevRussiaE) comes in fifth place, and Brazilian president Dilma Rouseff (@dilmabr) comes in sixth place.

Other countries with leaders who have Twitter accounts include, Germany, India, Morocco, Tunisia, India, Argentina, Somalia among others. Even Pope Benedict XVI (@Pontifex) has Twitter presence.

For more information visit: Digital Daya: World Leaders on Twitter – Ranking Report, December 2012.


The Cheapest and Most Expensive Places to Fill Your Gas Tank

click to enlarge

Gas prices go up or down according to supply-demand forces and to movements in the commodities market. According to this map, published by the Car and Driver blog, prices in the United States ($3.85 per gallon) are not that bad compared to gas prices in other countries.

European nations have the highest gas prices, above $7 per gallon. If you were in Turkey you will have to pay the highest price, a steep $9.39 per gallon. Turkey’s gas prices are followed by Norway ($9.38), Italy ( $9.00), Sweden ($8.75), the United Kingdom ($8.46), Germany ($8.29), and Iceland ($8.01).

In the Americas, the highest gas prices can be found in Belize ($7.59), followed by Uruguay ($6.99), Chile($6.60), Peru ($5.95), Argentina ($5.52) and Canada ($5.14). Gas prices are significantly low in Venezuela ($0.06) and Bolivia ($2.05) due to government subsidies.

Africa enjoys low gas prices, except for Djibouti ($6.48), Madagascar ($5.74), Zimbabwe ($5.38), and South Africa ($5.15).

In Asia, Japan pays the highest gas prices, $6.87 per gallon, followed by the Philippines ($5.43), and India ($5.42).

In Australia, New Zealand and Australia’s gas prices per gallon are $6.75 and $5.64, respectively.