Tag Archives: weather

The Most Devastating Tornadoes in the U.S. Since 1950

killer tornadoes since1950 usIn lieu of the killer tornado that hit Oklahoma city on May 20, 2013, Slate published a map of the most devastating tornadoes to hit the United States since 1950.

As seen in the map, the southwest is the region with the highest frequency of devastating tornadoes.

Source: Slate: Map of the Week: All Killer Tornadoes Since 1950


Where Lightning Strikes

Lightning strikes are defined as electrical discharges caused by electrical imbalances in the sky. Lightning is one of the top three storm-associated killers.

The map at the top shows the frequency of lightning strikes in different parts of the world. The color yellow indicates the regions with the highest average of lightning strikes per square kilometer per year. The Democratic Republic of Congo (Africa), Colombia (South America), and the Caribbean islands stand out in this map as being regions frequently hit by lightning strikes.

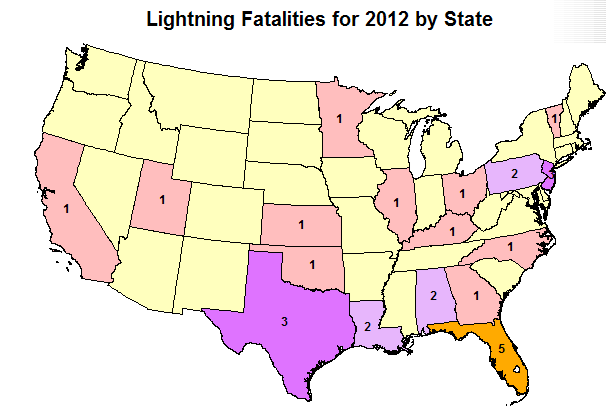
In the U.S. a total of 28 lightning fatalities occurred in 2012. The Southern states seem to be prone to lightning strikes. In 2012, Florida experienced 5 lightning fatalities, followed by the state of Texas with 3.

Sources:

Also recommended: The Atlantic: Lightning Strikes [Photo Gallery]
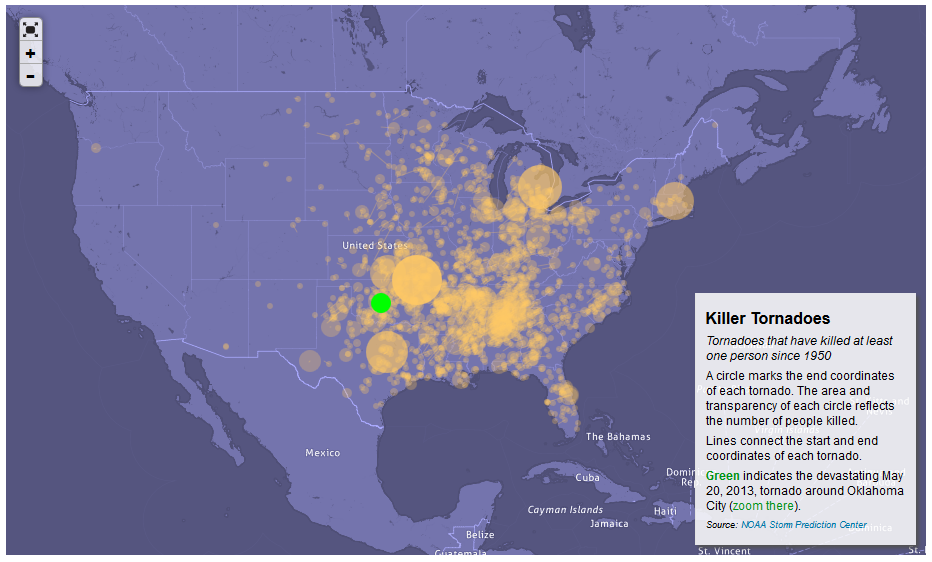
 

Record Warm Temperatures Registered in 2012

click to enlarge

Temperatures for the U.S. contiguous states in 2012 were 1 degree Fahrenheit warmer than the previous record temperatures of 1998. Based on preliminary data the National Oceanic and Atmospheric Administration (NOOA) created the map above, where it can be clearly seen that across the nation warmer temperatures were registered. Nineteen states from Massachusetts to Utah, experienced record warmer temperatures.

2012 was also a year of record low levels of precipitation, below average. Drier than average conditions affected the central parts of the United States, with negative consequences for agriculture. The winter season 2011-2012 was affected by higher than normal warm temperatures as well.


The Wild Wild Weather

click to enlarge

Temperatures on the Earth’s surface and moisture levels in the atmosphere have been on the rise. These two factors might be at the root of the drastic change in weather patterns causing severe droughts, heat waves, heavy rains and other extreme weather phenomena.

In its September 2012 edition, the National Geographic magazine featured an extensive article on extreme weather affecting the U.S.


Billion Dollar Weather Disasters

Billion dollar weather events by state

As the economic damage from Hurricane Sandy is still being evaluated, we took a look at the damage from weather/climate-related disasters over the past 30 years. The National Climatic Data Center (NCDC) at the National Oceanic and Atmospheric Administration keeps detailed statistics of all weather disasters in the US. One of the visualizations the NCDC has created is a thematic map of billion-dollar weather events, which can be seen above. The map shows the number of events that caused at least a billion dollars in damage by state. Southern states suffered the most damage up until 2011. The colors in the map may look significantly different once the total tally of Sandy is calculated.