Category Archives: Charts

Energy Consumption in China

The National Bureau of Statistics of China reports energy consumption in metric tons of Standard Coal Equivalent. The graph below shows that total energy consumption in China grew from 571 million tons of SCE in 1978 to 2462 million tons of SCE in 2006. Note that one SCE equals 29.31 Giga Joules (low heat).

Energy consumption in China 1978-2006

Source: National Bureau of Statistics of China

You may also want to see our China section for more facts and statistics.

World Oil Consumption

The energy statistics section now includes regional production and consumption charts. The regions available are:

Production and consumption numbers are available for coal, crude oil, dry natural gas, hydroelectric power, natural gas plant liquids, nuclear power, and alternative fuels. Leave me a comment if you find the new charts useful.

A Picture is Worth a Thousand Words

When writing about fluctuations in the price of commodities, you can now use our graphs to illustrate your point. For instance, take a look at the graph below. It shows the IMF Commodity Price Index (for all commodities) for the past fifteen years.

Commodity Price Index - Commodity Prices

The index has increased by 281.93%!

You can draw you own conclusions, but the important point is that embedding our graphs is now as simple as copying and pasting a bit of HTML code. Clicking on the graph will let you explore other time frames or choose a different price index or commodity.

Embeddable Oil Production Charts

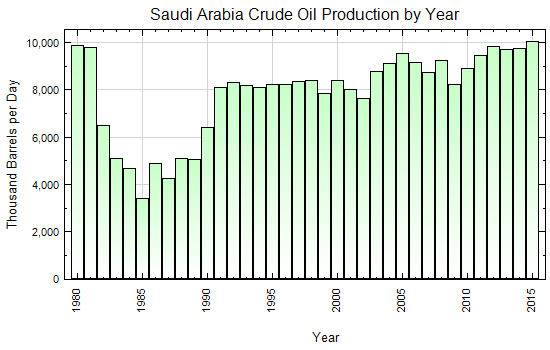
You can now embed our energy production and consumption charts in your own blog or web site. The example below shows Saudi Arabia’s yearly crude oil production since 1980. The source of the data is the United States Energy Information Administration (EIA). Note that the EIA releases yearly numbers with a lag of up to three years.

Saudi Arabia Crude Oil Production by Year (Thousand Barrels per Day)

The code I used to display the chart is shown below:

To obtain a different graph, change the following query string parameters:

country: two-character ISO country code. Example: us for the United States, fr for France
product: one of the following products: coal, oil, gas, hydro, ngl, nuclear, other
graph: production or consumption
lang: two-character ISO language code. Currently en is the only recognized value.