Category Archives: Trade

Milk Consumption Per Capita Worldwide

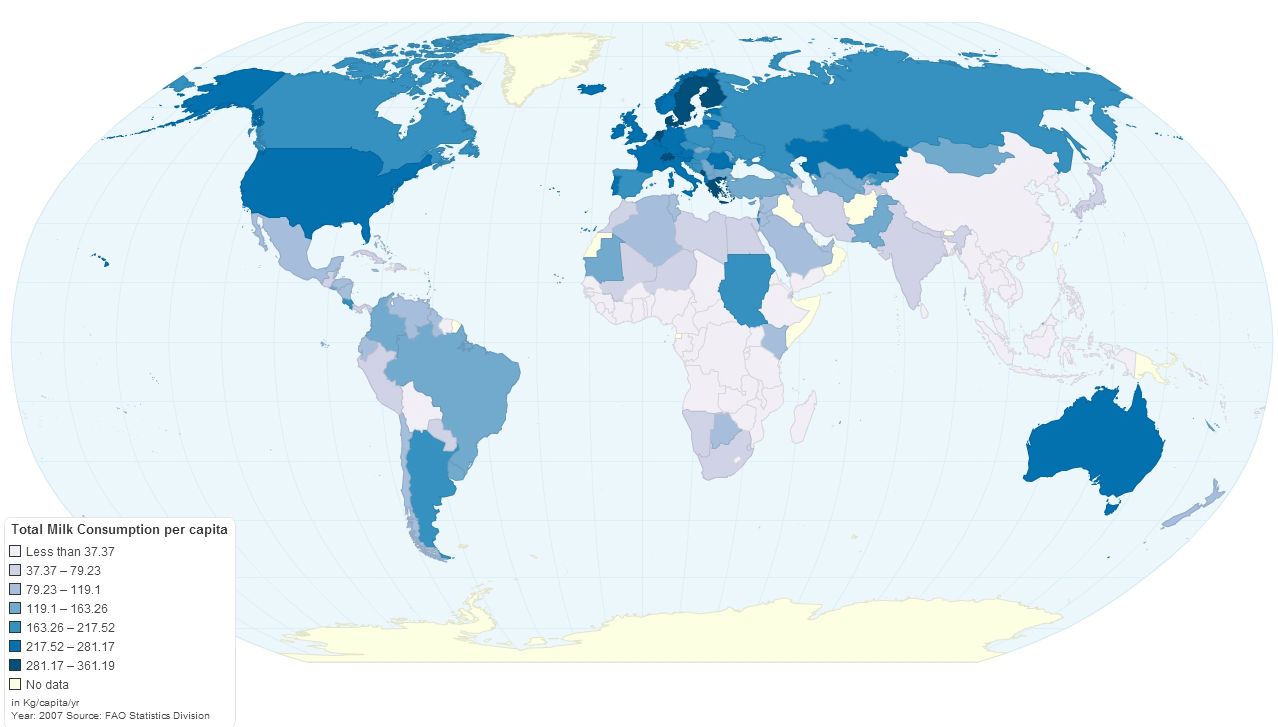
Milk and milk products are consumed all over the world on a daily basis. As shown in the graph above, the largest consumers of milk in the Americas are the U.S., Canada, Nicaragua, and Argentina. In Europe the largest consumers of milk are Sweden, Finland, Netherlands, Switzerland, Portugal, Greece, and Kazakhstan. In Africa, we have Sudan and South Sudan. Australia is also one of the largest consumers of milk.

The consumption of milk in this map is defined as Kg. of milk consumed per person per year.

Resource: Food Beast: Map of Milk Consumption & Lactose Intolerance Around the World


Food Exports and Imports Worldwide

Some countries are net exporters of food (their food exports are larger than their food imports) while others are net importers of food (their food imports are larger than their food exports).

Among the net exporters of food we find the majority of South American countries, with the exception of Venezuela and Suriname, the United States, Canada, Mauritania, Indonesia, Australia, and a few African countries such as Mauritania, Ivory Coast and Ghana. The largest net exporter of food, by far, is Argentina with $23.42 of food exports per every $1.00 of food imports. Argentina is followed by Brazil, New Zealand, Paraguay and Iceland.

Among the net importers of food we find countries such as Russia, Finland, Sweden, the UK, Italy, Germany, Portugal, Sudan, Cuba, Saudi Arabia, Japan, etc. The largest net food importer is Eritrea, with $0.01 of food exports per every $1.00 of food imports. Eritrea is closely followed by Venezuela, Turkmenistan, and Algeria.

Data for for both agricultural exports and imports are for 2010.

Source: Slate.com: Maps: Agriculture in the U.S. and Around the World


Sweet Deal: The Global Trade of Chocolate

click to enlarge

This visualization by The Guardian, actually made out of real chocolate, depicts the world trade (exports and imports) of chocolate. Between 2010 and 2011, 4.24 million tons of cocoa beans were processed worldwide.

The top cocoa bean producers are: Ivory Coast, Ghana, Indonesia, Nigeria, Cameroon, Brazil, and Ecuador, among others. The top importers include: Netherlands, the United States, Germany, Malaysia, Belgium, France, the UK, and Spain.

For a list of the top global confectionery companies, visit: International Cocoa Organization: The Chocolate Industry


Coffee Consumption Per Capita Worldwide

Coffee production and consumption is believed to have originated in Africa, more specifically in the province of Kaffa, Ethiopia. In the fifteen century it was already present in the Middle East. From there it spread to Italy and then to the rest of Europe. From Europe it traveled to the New World, where it was first cultivated in the Caribbean island of Martinique. During the first quarter of the eighteen century it was brought to Colombia and Brazil.

Coffee is an important cash crop in many developing countries. It is also an important commodity traded in major commodity exchanges around the world. The largest coffee producers include: Burundi, Ethiopia, Rwanda, Honduras, Uganda, and Nicaragua among others.

According to ChartsBin, coffee consumption around the world is estimated at 1.3 Kilograms per person per year (a total of 7,358,897 metric tons). In the map above, we can see that the countries with the largest coffee consumption per capita include: Finland (12 Kg. per person per year), Norway, Iceland, Denmark, Netherlands, Switzerland, followed by Canada, Germany, Brazil and other western European nations.

Sources:


Colombian Coal

We recently added Colombian coal to the list of commodities that we track in our commodities section. You can now analyze the average monthly price of Colombian coal for the past 30 years, as seen in the graph below.

Coal, Colombia - Monthly Price - Commodity Prices - Price Charts, Data, and News - IndexMundi

In addition to monthly price data, we also have production, consumption, exports, and imports of Colombian coal in terms of quantity, and value in dollars of Colombian coal exports and imports.

Will China Dominate the World Beer Market?

According to a report by the Kirin Institute of Food and Lifestyle, in 2010 China remained the largest consumer of beer for the eight consecutive year. China’s beer consumption increased 5.9% with respect to 2009, with a share of 24.5% of total world beer consumption.

In the world trade arena, though, China is still a small player. China’s imports of beer for 2010 amounted to only 0.56% of total world beer imports, way below the United States (37%), France (6.8%) and the UK (6.6%). China’s exports for the same year amounted to only 1.4% of total world beer exports, below Mexico (21%), the Netherlands(19%), Germany (13%), and the United States (3.4%) to name a few. However, because of the size of China’s economy, there is a huge potential for the world’s largest beer exporters to see China with a lot of optimism. Read more…