Category Archives: Oil

Oil Production and Consumption by Country

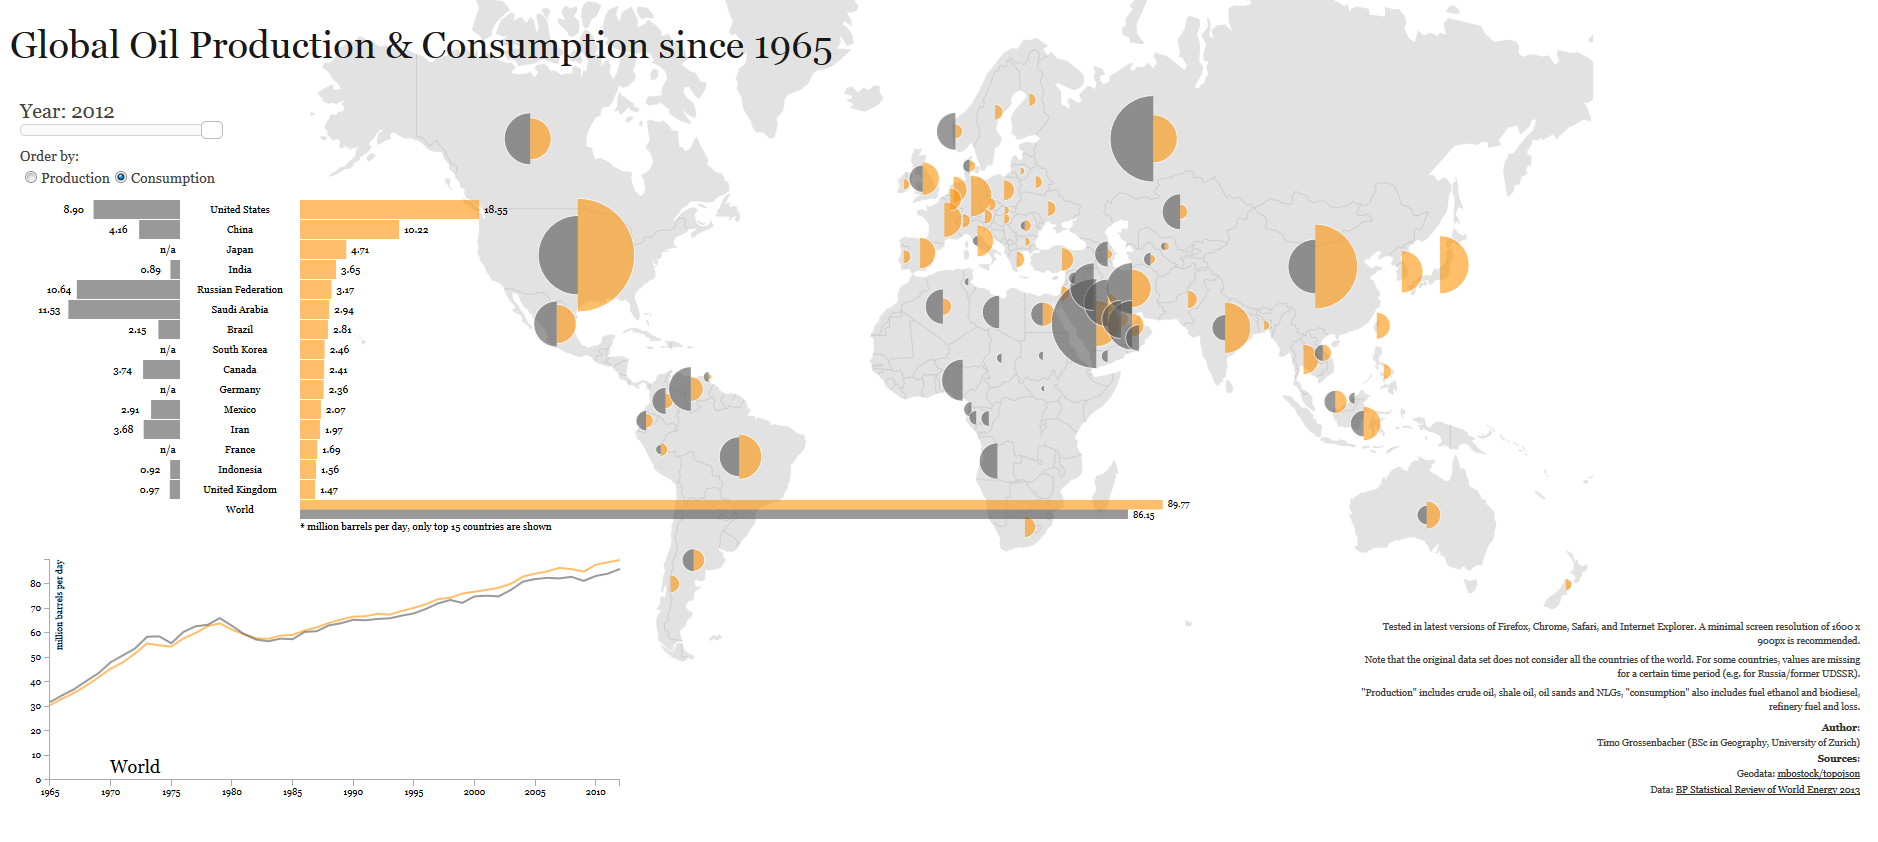
oil production and consumption since 1965When it comes to oil production and consumption, countries have a very close relationship of interdependence with each other. Some countries consume more oil than what they produce relying on imports to satisfy their internal demand. Others, consume less than what they produce, being able to export oil to nations that need it.

Oil consumption (yellow) for the United States, for example, was larger than its production (grey) for 2012, 18.55 mb/d (million barrels per day) compared to 8.9 mb/d, importing more than double its production to satisfy the gap in internal demand. Other nations with oil consumption higher that oil production include China, Brazil, Australia, India, UK, and Indonesia.

In contrast, oil consumption for Saudi Arabia for 2012 is estimated at 2.94 mb/d, while its production reached 11.53 md/d, exporting its oil surplus to the rest of the world. Other nations whose oil production exceeds its oil consumption include Canada, Mexico, Venezuela, Norway, Russia, Kuwait, United Arab Emirates, and Qatar.

Source: Winston Smith Labs: Global Oil Production and Consumption since 1965 [Interactive Map/Graph]


Gasoline Spending by State in the U.S.

gas guzzlers mint finalMint.com tracked how much its users spend on gasoline in one month, and how many times they visit the pump in the same period across the United States.

On average, Americans spend $177 on gas in single month, making an average of 6 visits to the pump, and spending an average of $32 in each transaction.

San Jose (California) stands out as the city where Mint users spend the most on gas, an average of $216 in a single month. Other cities where Mint users spend a lot on gas include Birmingham (Alabama), Jacksonville (Florida), Phoenix (Arizona), and Charlotte (North Carolina) to name a few. In contrast, in cities like New York, Brooklyn (New York), and Washington D.C., which have a good public transportation system, the gas bill is between $102 and $112 per month.

Source: Mint: Gas Guzzlers


The World’s Largest Oil Reserves by Country

strategic oil reserves worldOil reserves are the amount of oil that can be technically and economically recovered from the ground.

Nations with the world’s largest oil reserves include Saudi Arabia, Venezuela, Iran, Iraq, Kuwait, United Arab Emirates, Russia, and Libya. Saudi Arabia, holds an approximate 234.5 billion barrels of oil reserves, and it has the largest market share for oil production after Russia. Saudi Arabia is followed by Venezuela, with an estimated 211.0 billion barrels of oil reserves, although its current oil production market share is only 3.2%.

By comparison, the United States has an estimated 30.9 billion barrels in oil reserves, and  8.7% market share in oil production.

Source: Spiegel Online: A World without Oil: Companies Prepare for a Fossil-Free Future


Gasoline Prices in Europe by Country

According to Russian news agency Ria Novosti, Norway has the highest gasoline price among European countries, with a price of 1.90 Euro per liter ( or US $9.475 per gallon at the current exchange rate of 1 Euro = US $1.31). Norway is followed by Italy, Netherlands, Sweden, and Greece.

The lowest gasoline prices are found in Belarus and Kazakhstan, 0.68 Euros and 0.70 Euros per liter, respectively. The average gasoline price for European nations is 1.39 Euros per liter.


Fossil Fuel Subsidies Globally

Fossil fuel subsidies are very common in developing nations. Subsidies cover the difference between the price at which fossil fuels are sold inside the country and their actual price in international markets, creating a huge fiscal burden (an estimated $400 billion annually) for the countries that provide them. Developing nations with fossil fuel subsidies include: Venezuela, Argentina, Ecuador, Algeria, Libya, Egypt, Kuwait, Iran, Pakistan, Russia, China, India, Indonesia, etc.

Developed nations also provide subsidies in the form of tax breaks to the oil industry and other measures (estimated at a cost of $45 to $75 billion per year). Nations in this group include many OECD (Organization for Economic Co-operation and Development) members.

For the interactive map, visit: National Geographic: The Great Energy Challenge: Fossil Fuel Burden on State Coffers


The Cheapest and Most Expensive Places to Fill Your Gas Tank

click to enlarge

Gas prices go up or down according to supply-demand forces and to movements in the commodities market. According to this map, published by the Car and Driver blog, prices in the United States ($3.85 per gallon) are not that bad compared to gas prices in other countries.

European nations have the highest gas prices, above $7 per gallon. If you were in Turkey you will have to pay the highest price, a steep $9.39 per gallon. Turkey’s gas prices are followed by Norway ($9.38), Italy ( $9.00), Sweden ($8.75), the United Kingdom ($8.46), Germany ($8.29), and Iceland ($8.01).

In the Americas, the highest gas prices can be found in Belize ($7.59), followed by Uruguay ($6.99), Chile($6.60), Peru ($5.95), Argentina ($5.52) and Canada ($5.14). Gas prices are significantly low in Venezuela ($0.06) and Bolivia ($2.05) due to government subsidies.

Africa enjoys low gas prices, except for Djibouti ($6.48), Madagascar ($5.74), Zimbabwe ($5.38), and South Africa ($5.15).

In Asia, Japan pays the highest gas prices, $6.87 per gallon, followed by the Philippines ($5.43), and India ($5.42).

In Australia, New Zealand and Australia’s gas prices per gallon are $6.75 and $5.64, respectively.


World Oil Consumption

The energy statistics section now includes regional production and consumption charts. The regions available are:

Production and consumption numbers are available for coal, crude oil, dry natural gas, hydroelectric power, natural gas plant liquids, nuclear power, and alternative fuels. Leave me a comment if you find the new charts useful.