Tag Archives: income

How Americans Spent Money in 2012


how americans spend money

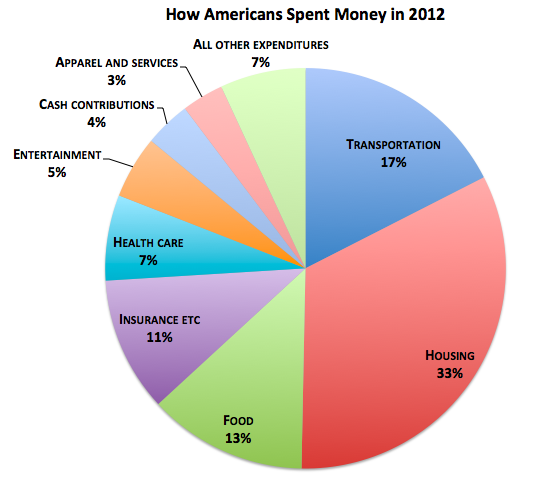
Housing, food, transportation, and clothing account for an estimated 66% of income spent for an average American household in 2012.

According to The Atlantic, housing, food and clothing account for more than 60% of expenses for the poor. Basically, most of their income is spent is covering basic needs and not much, or none, is left for savings. The rich, by contrast, have a larger margin that can be spent in entertainment, insurance, and savings.

Source: The Atlantic: Where Americans—Rich and Poor—Spent Every Dollar in 2012


Food Spending by Country

Food spending by country

The share of household spending devoted to food and drink varies widely by country, as shown in the chart above recently published by The Economist using data from the US Department of Agriculture. The chart shows that Americans spend less than 10% of their income on food and drink, whereas people in Cameroon spend close to 50%. What percentage of your income pays for food and drink?

The Rise of Residential Segregation by Income

residential segregation by income

A new report by the Pew Research Center shows that residential segregation by income in the U.S. has increased during the past 30 years in 27 of the 30 largest major metropolitan areas. Check the report to find out details about your city. You can also click on the map above to see visualizations of income segregation for the largest metropolitan areas, e.g. New York, Los Angeles, Chicago, and Houston.