Tag Archives: United States

Cocaine Consumption by Country

click to enlarge

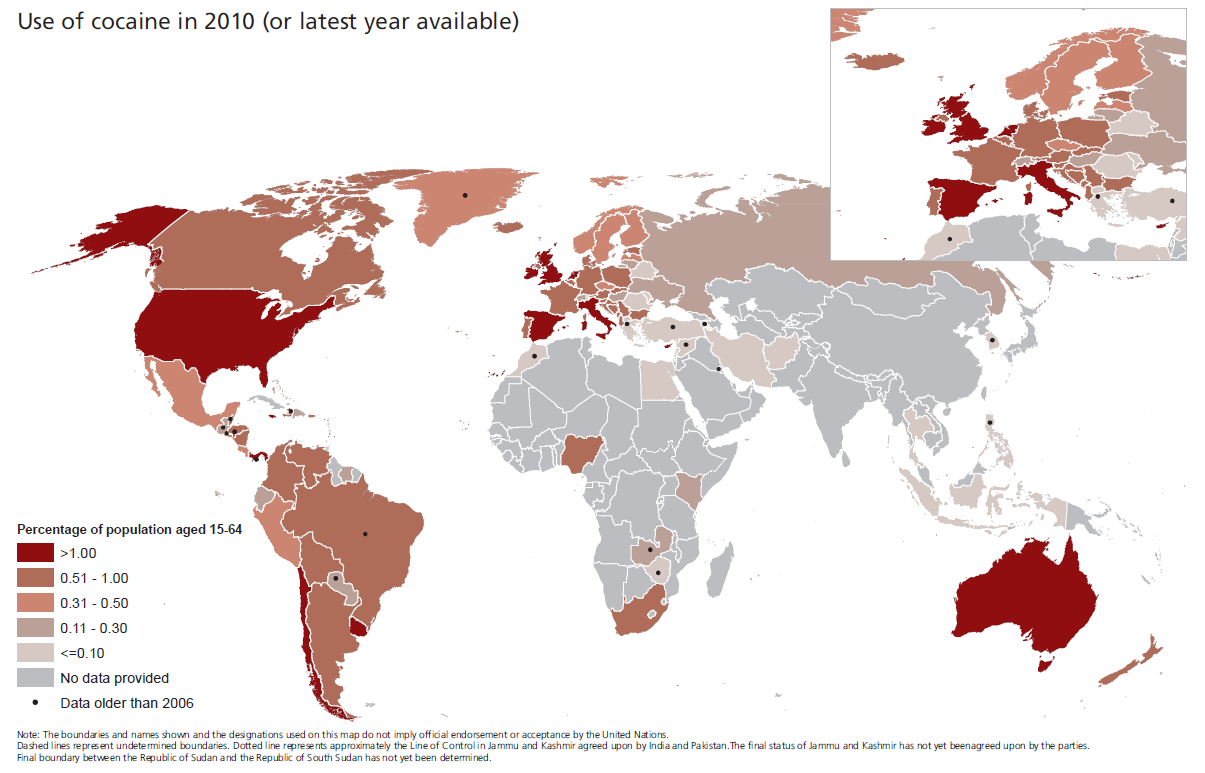
Illicit drugs consumption seems to be relatively stable around the world, except in developing countries, where it seems to be on the rise. Although the total area for the cultivation of the coca leaf has decreased 33% since 2000, 18% decrease between 2007 and 2010, the number of deaths from heroin and cocaine abuse is estimated at 200 thousand per year.

This map shows cocaine consumption around the world, the richest countries being among the top consumers. Complete details can be found at: United Nations Office of Drug and Crime (UNODC) – World Drug Report 2012


Pop, Soda or Coke?

click to enlarge

According to this map by the Department of Cartography and Geography of the East University in Oklahoma, people have different names for soft drinks in different areas of the United States. Soda is the name used in California, Nevada, Arizona, and parts the North East region. Pop is the name referred to in the Northern half of the U.S. and Coke is the popular name used in the Southern states. This map was based upon 120,464 respondents.


The Congested Skies of America

This interesting animation shows air traffic over the United States on a given day. It was created using real air traffic data from the Federal Aviation Administration (FAA). The animation covers the period 8PM to 8PM EST of the following day. In the middle of the night, the number of aircraft on the air is about nine hundred. In the middle of the day, the number of aircraft on the air is around five thousand. Most air traffic is concentrated in the Northeastern part of the country and the main traffic hubs can be distinguished by the number of aircraft concentrated around them.


U.S. States Get More Drunk

click to enlarge

According to an article published by Scientific American, based on data from the Center for Disease Control and Prevention (CDC), heavy drinking has increased in several states. The heaviest drinking states are located in the Northeast, the worst of all Vermont, based on data for 2010. Heavy drinking is defined as two or more drinks per day for men, and one or more drinks per day for women.


Housing Market: Home Prices are Up!

The latest numbers for the S&P/Case-Shiller House Price Index, just released, show an increase in home prices for twenty major cities in the United States. Both the 20-City Composite and 10-City Composite show similar trends, the first with a 1.6% increase and the second with a 1.5% increase for the month of July 2012. This numbers constitute a second year-over-year rise, following a decline in 2010 caused by the end of the Housing Stimulus package in April of that same year.


How Does Your Country Compare to U.S. States?

These interactive maps from the Economist provide an interesting comparison between different countries and US states.

Using the criteria of GDP (Gross Domestic Product), the economy of California is approximately the size of Italy, Texas the size of Russia, Florida the size of the Netherlands, and Alabama the size of Nigeria.

Using the criteria of Population, California is approximately the size of Poland, Washington  the size of Lebanon, Arizona the size of Libya, and Minnesota the size of Finland, to name a few.


Poverty in the U.S. and Around the World

  1. The Poverty Line: One day, one person (The Poverty Line)
  2. World Population Below The Poverty Line – Map (IndexMundi)
  3. United States Poverty Rate by State 2006-2010 – Map (IndexMundi)
  4. United States – People of All Ages in Poverty: 2006-2010 by County – Map (IndexMundi)
  5. Global poverty, Absolute Poverty, Relative Poverty: A Fresh Look – Merrell J. Tuck-Primdahl (World Bank)

U.S. Drought Conditions Still Severe – July 19, 2012

  1. Updated U.S. Drought Map (U.S. Drought Portal)
  2. Ag Secretary Tom Vilsack on the worst drought in decades- Interview by Jeremy Hobson (Marketplace.com)
  3. High Corn Prices Will Raise Food Prices (Live Trading News)
  4. How droughts will reshape the United States – Brad Plumer (Washington Post)
  5. Grain futures hit highs on drought – Dow Jones Newswires (Agriculture.com)
  6. As corn burns, excess ethanol credits help dampen demand – Jonathan Leff and Janet McGurty, Reuters (Cattle Network)


Corn and Drought Conditions – July 17, 2012

  1. STOCKS FALL, CORN SURGES: Here’s What You Need To Know – Sam Ro (Business Insider)
  2. DJ U.S. CORN: Trading Up On Drought, Worse Crop Condition Ratings – Dow Jones Commodities News (TradingCharts.com)
  3. Drought Likely to Hit You Hard in the Pocketbook – Seth Perlman (Wltx.com)
  4. U.S. Affected by Drought Conditions: Interactive Maps (U.S. Drought Portal)