
click to enlarge
Temperatures for the U.S. contiguous states in 2012 were 1 degree Fahrenheit warmer than the previous record temperatures of 1998. Based on preliminary data the National Oceanic and Atmospheric Administration (NOOA) created the map above, where it can be clearly seen that across the nation warmer temperatures were registered. Nineteen states from Massachusetts to Utah, experienced record warmer temperatures.
2012 was also a year of record low levels of precipitation, below average. Drier than average conditions affected the central parts of the United States, with negative consequences for agriculture. The winter season 2011-2012 was affected by higher than normal warm temperatures as well.
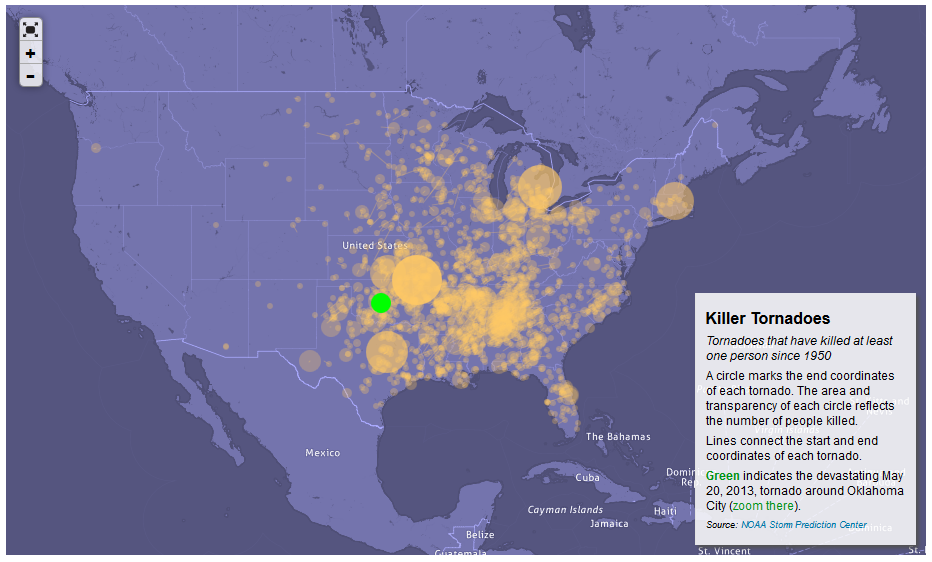 In lieu of the killer tornado that hit Oklahoma city on May 20, 2013, Slate published a map of the most devastating tornadoes to hit the United States since 1950.