Do you live in a failed state? Check the 2012 failed states index to find out.

")
For someone living in a country where corruption is widespread, it is very easy to cite examples of corruption, bribery, graft, traffic of influences, nepotism, etc. Measuring corruption in a systematic way is, in contrast, a much more difficult task. Going through the database of World Bank indicators we found two indicators directly related to corruption:
Click on the links above to find out where your country ranks in terms of corruption. Note though that the World Bank does not have data for all countries.
For a far more comprehensive effort at measuring corruption, you may want to check the web site of Transparency International and its annual reports on corruption.
Today is World Health Day in commemoration of the founding of the World Health Organization (WHO). Here are some country health indicators which are relevant to the state of human health in our planet.
Are you surprised by any of the indicators above?
After the financial crisis of the recent years, there are countries that have fared better than others, due in part to a transfer of capital from financial markets in developed countries to emerging market economies.
To identify the winners and losers, economists Ignacio Munyo and Ernesto Talvi calculated a Global Index of Economic Exuberance where the winners are Argentina, Angola, and Brazil, and the losers are Hungary, the United States, and Kazakhstan.
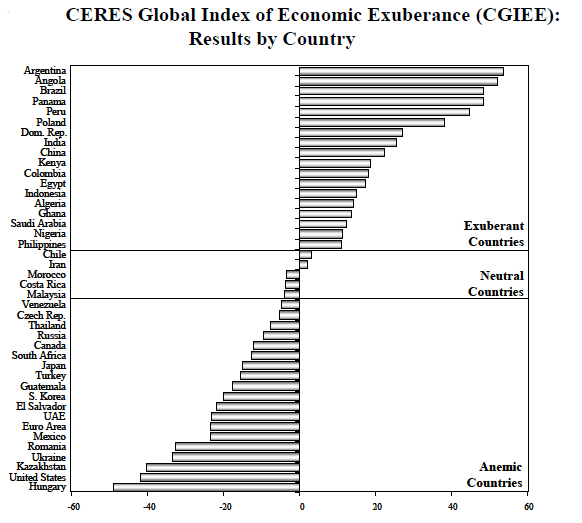
CERES: Center for the Study of Economic and Social Affairs
The number of intentional homicides by country, and the rate of homicides per 100,000 population is shown in the table below.
Counts
Rates per 100,000
Country
2005
2006
2005
2006
Algeria
204
214
0.62
0.64
Argentina
2,115
2,052
5.46
5.24
Armenia
55
75
1.82
2.49
Austria
54
61
0.65
0.73
Azerbaijan
192
190
2.30
2.26
Bahrain
4
7
0.55
0.95
Bangladesh
3,431
4,123
2.24
2.64
Belarus
836
734
8.53
7.53
Belize
81
92
29.40
32.67
Bolivia
478
454
5.21
4.85
Bosnia and Herzegovina
70
73
1.79
1.86
Brunei Darussalam
0
2
0.00
0.52
Canada
663
606
2.05
1.86
Costa Rica
338
348
7.81
7.91
Croatia
68
74
1.49
1.62
Cyprus
16
14
1.91
1.66
Czech Republic
104
136
1.02
1.33
Denmark
53
29
0.98
0.53
Dominican Republic
1,666
1,537
17.59
15.99
Ecuador
2,121
2,385
16.24
18.07
Egypt
364
440
0.50
0.59
El Salvador
3,779
3,927
56.67
58.07
England and Wales
766
755
1.43
1.41
Estonia
113
91
8.41
6.79
Finland
113
112
2.15
2.13
Georgia
403
323
9.01
7.29
Germany
780
727
0.94
0.88
Greece
127
109
1.14
0.98
India
32,719
32,481
2.88
2.82
Ireland
65
67
1.57
1.59
Italy
610
625
1.04
1.06
Jordan
67
100
1.21
1.75
Kazakhstan
1,804
1,729
11.86
11.29
Kenya
2,313
2,090
6.50
5.72
Kyrgyzstan
491
446
9.44
8.48
Latvia
130
148
5.65
6.47
Lebanon
94
23
2.34
0.57
Liechtenstein
0
0
0.00
0.00
Lithuania
369
277
10.77
8.13
Malaysia
497
604
1.94
2.31
Malta
4
0
0.99
0.00
Mauritius
37
50
2.98
4.00
Mexico
11,372
11,558
10.91
10.97
Monaco
1
1
3.08
3.07
Mongolia
310
311
12.01
11.94
Montenegro
22
25
3.62
4.16
Morocco
160
162
0.52
0.53
Nepal
564
509
2.08
1.84
Netherlands
197
159
1.21
0.97
New Zealand
61
47
1.49
1.14
Nicaragua
436
465
7.98
8.41
Northern Ireland
26
23
1.51
1.33
Norway
33
33
0.71
0.71
Occupied Palestinian Territory
145
3.85
Panama
364
363
11.26
11.04
Paraguay
887
742
15.02
12.33
Philippines
3,240
3,296
3.83
3.82
Poland
555
490
1.45
1.28
Portugal
175
227
1.66
2.15
Republic of Moldova
226
184
5.83
4.80
Romania
457
438
2.11
2.03
Scotland
81
109
1.59
2.13
Serbia
142
144
1.44
1.46
Singapore
21
17
0.49
0.39
Slovakia
72
65
1.34
1.21
Slovenia
20
12
1.00
0.60
Spain
405
336
0.93
0.77
Sweden
127
115
1.41
1.27
Switzerland
75
60
1.01
0.80
Syrian Arab Republic
206
239
1.09
1.23
Tajikistan
157
228
2.40
3.43
Thailand
5,141
5,023
8.16
7.92
The former Yugoslav Republic of Macedonia
44
41
2.16
2.01
Turkey
3,082
2,999
4.22
4.06
Turkmenistan
162
142
3.35
2.90
Ukraine
3,030
2,958
6.46
6.35
United Arab Emirates
56
39
1.36
0.92
United States of America
16,740
17,034
5.58
5.62
These figures are collected by the United Nations Office on Drugs and Crime through its Survey of Crime Trends. Its definition of intentional homicide is “death deliberately inflicted on a person by another person, including infanticide”.
The energy statistics section now includes regional production and consumption charts. The regions available are:
Production and consumption numbers are available for coal, crude oil, dry natural gas, hydroelectric power, natural gas plant liquids, nuclear power, and alternative fuels. Leave me a comment if you find the new charts useful.