Tag Archives: water consumption

Industrial Water Consumption by Country

Across the globe, freshwater is consumed by four different economic sectors: domestic, industry, energy and agriculture. The agricultural sector is the largest consumer of water. The industrial and energy sectors follow suit, using 20% of available water resources.

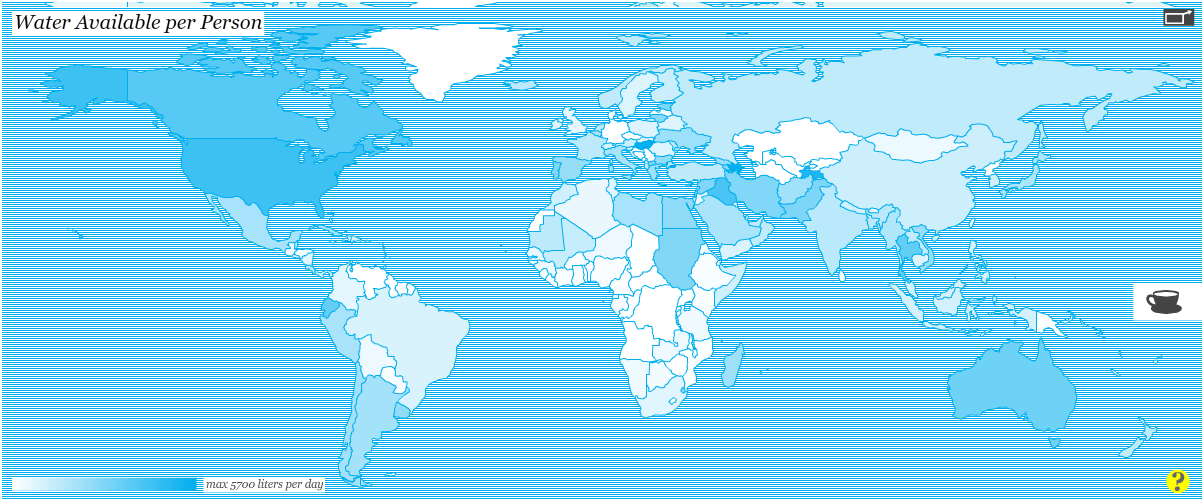
This map (above), published by the Sustainable Sanitation and Water Management Toolbox, shows how much water is used by the industrial sector by each country. For the year 2009, the largest consumers of water for industrial use were the U.S. and Europe. Water consumption by the industrial sector accounted for 50% of total water use.


Water Available Per Person Worldwide

click to enlarge

March 22, 2013 has been designated World Water Day by the United Nations. In that regard, we wanted to see how much water is available per person per day across the planet.

The map above, winner of the Urban Water Design Challenge for Interactive Water Footprint Infographic at Harvard University, shows how much water is available for each person in a single day in each country.

Countries with the largest amount of water available per person per day (dark areas) include: the United States (4,382 litters/day), Canada (3,796 litters/day), and Ecuador (,3516 litters/day) in the Americas; Hungary (5,704 litters/day) in Europe; Azerbaijan (5,619 litters/day), Iraq (4,060 litters/day), and Tajikistan (5,033 litters/day) in Asia; Sudan (2,822 litters/day), and Egypt (2,527 litters/day) in Africa.

For the interactive infographic and other interesting visualizations about water, please visit: Circle of Blue: Harvard Students Win Urban Water Design Challenge for Interactive Water Footprint Infographic