Tag Archives: United Nations

Economic and Human Impact of Natural Disasters

economic and human impact of disasters
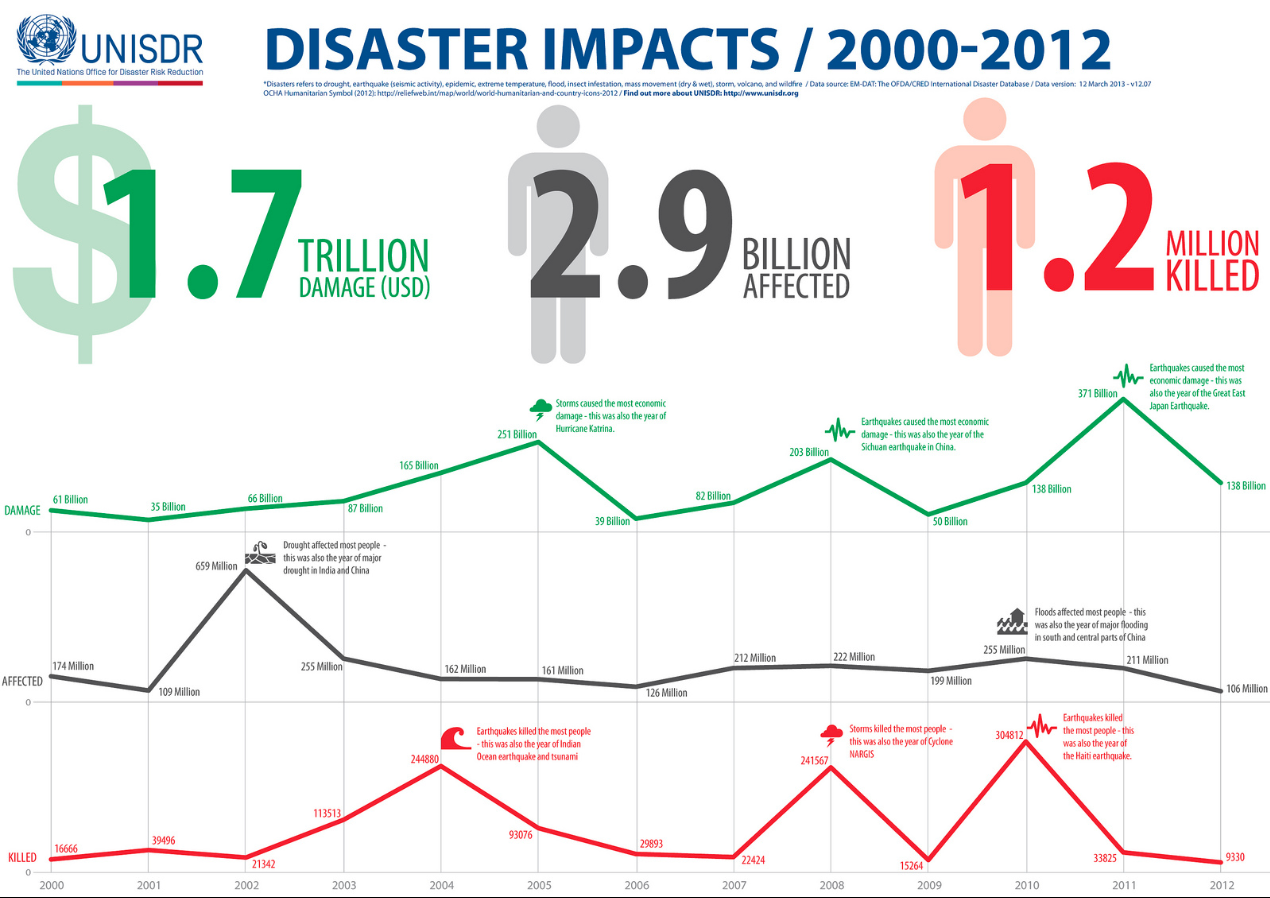
This visualization by the United Nations Office of Disaster Risk Reduction (UNISDR) shows the impact of natural disasters in the period 2000-2012.

Between 2009 and 2011 the economic cost of disasters increased from $50 billion to $371 billion due to the 2011 Great East Japanese Earthquake. The largest number of people killed occurred in the period 2009-2010, mainly due to earthquakes, including the 2010 Haiti earthquake. The largest number of people affected in the last twelve years occurred between 2001 and 2002, mainly due to droughts, including droughts in China and India.

Source: United Nations on Tumbler


Elimination of Chemical Weapons Worldwide

elimination of chemical weapons worldThe Organization for the Proliferation of Chemical Weapons (OPCW) was created to oversee the elimination of existing chemical weapons and monitor the chemical industry to prevent the production of additional chemical weapons. The OPCW was created in 1997 in The Hague, Netherlands, with support from the United Nations (UN).

The OPCW has 188 members states, signatories of the Chemical Weapons Convention (CWC). Nations that did not sign the CWC include Syria, Egypt, South Sudan, Somalia, Angola, and North Korea. Myanmar signed it, but it has not ratified it to date.

As of 2012, 71% of global stockpiles of chemical weapons have been destroyed, 46% of the total amount of chemical munitions have been eliminated, and 100% of the chemical plants producing chemical weapons have been decommissioned.

Source: Ria Novosti News Agency: Infographics – Elimination of Chemical Weapons in the World


Water Available Per Person Worldwide

click to enlarge

March 22, 2013 has been designated World Water Day by the United Nations. In that regard, we wanted to see how much water is available per person per day across the planet.

The map above, winner of the Urban Water Design Challenge for Interactive Water Footprint Infographic at Harvard University, shows how much water is available for each person in a single day in each country.

Countries with the largest amount of water available per person per day (dark areas) include: the United States (4,382 litters/day), Canada (3,796 litters/day), and Ecuador (,3516 litters/day) in the Americas; Hungary (5,704 litters/day) in Europe; Azerbaijan (5,619 litters/day), Iraq (4,060 litters/day), and Tajikistan (5,033 litters/day) in Asia; Sudan (2,822 litters/day), and Egypt (2,527 litters/day) in Africa.

For the interactive infographic and other interesting visualizations about water, please visit: Circle of Blue: Harvard Students Win Urban Water Design Challenge for Interactive Water Footprint Infographic 

Forest Areas as a Percentage of Land Area Worldwide

March 21, 2013 has been declared the first International Forest Day by the United Nations. In that light, we decided to take a look at one key environmental indicator that measures the percentage of forest area present in different regions of the planet.

The map above, created by the World Bank depicts forest areas as a percentage of land area for each country. Forest area is defined as land, natural or planted, under groves of trees of at least 5 meters (productive or not), excluding tree groves in agricultural production systems.

Countries with the highest forest area as a percentage of land area (dark red areas) include: Guyana, Suriname, and Belize in the Americas; Finland and Sweden in Europe; Bhutan, Laos, Japan, South and North Korea in Asia; Guinea, Gabon, Democratic Republic of Congo, Congo, and Guinea Bissau in Africa; Papua New Guinea in Oceania.