Tag Archives: life expectancy

World Population Growth Over Time

population growth over time 1800-2050

World population growth accelerated in the last century. During the twentieth century alone, the number of people increased from 1.5 billion to 6 billion.

In the year 1800 the world’s population had reached 1 billion, with most people living in Asia and Europe. By 1927, 127 years later, the population of the world had doubled, reaching an staggering 2 billion people.
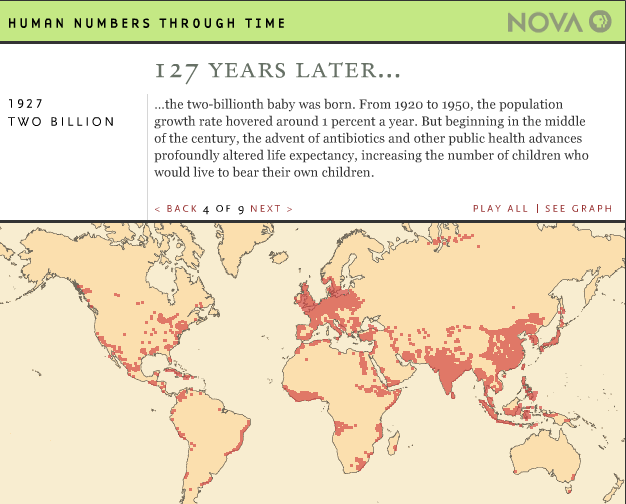
population growth over time 1927Population growth remained almost the same until 1950 when advances in science and medicine increased life expectancy, specially in developed nations.

The world’s population reached 3 billion inhabitants by 1960, 4 billion by 1974, 5 billion by 1987, 6 billion by 1999, 7 billion by 2011.
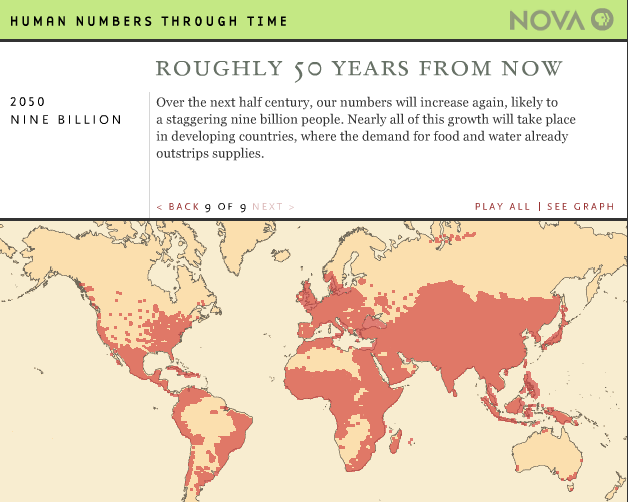
population growth over time 2050It is estimated that the population of the world will reach 8 billion by 2024, and 9 billion by 2050. Most of the growth will occur in developing nations

Source: NOVA: Human Numbers Through Time


North Korea vs. South Korea

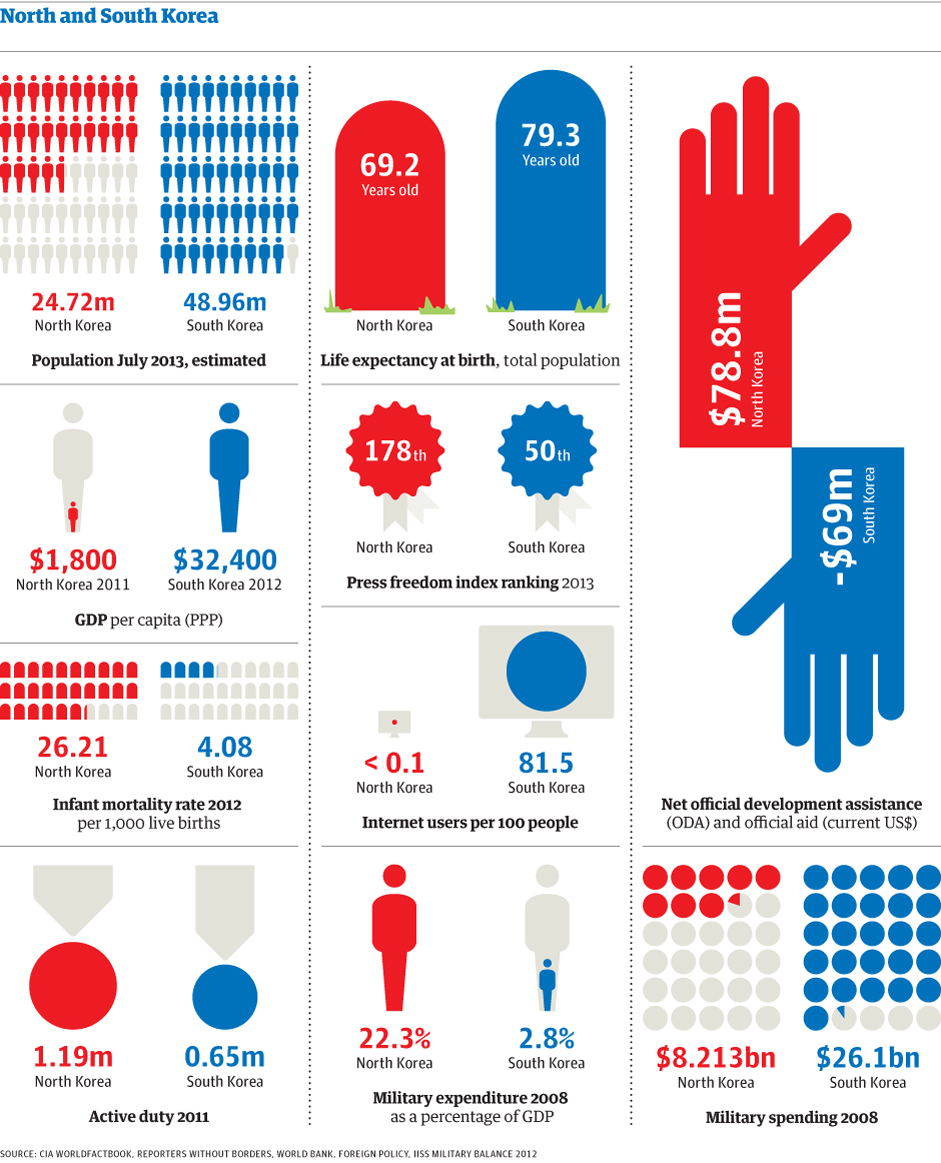
In this visualization created by The Guardian, we can see how North Korea compares to South Korea in terms of population, Gross Domestic Product (GDP), life expectancy, freedom of the press, military spending, internet connectivity, infant mortality, among other indicators.

North Korea is a poor country with half the population of South Korea. It is one of the worst countries in terms of corruption and freedom of the press. Its military spending constitutes approximately 22.3% of its GDP, compared to 2.8% for South Korea.

Additional resource: IndexMundi: South Korea vs. North Korea – Country Comparisons


The Happy Planet Index 2012

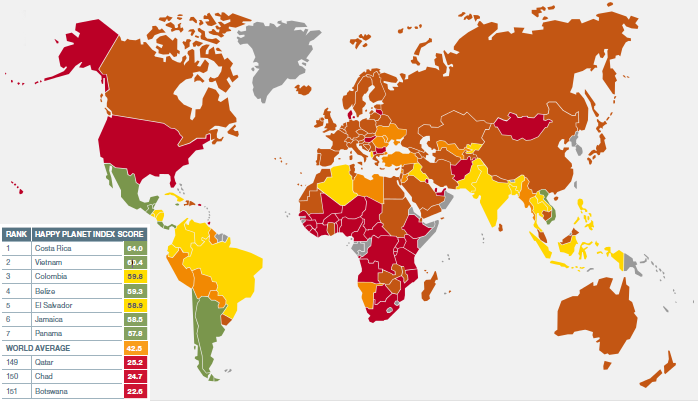
The Happy Planet Index (HPI) measures how countries provide their citizens with a long and happy existence within their borders.

The HPI measures three variables: experienced well-being, life expectancy and environmental footprint. Environmental footprint is a measure of resource consumption. Scores for each variable are combined to create an overall measurement, where the color green represents the best performance for all three variables. The HPI has been calculated for 151 countries.

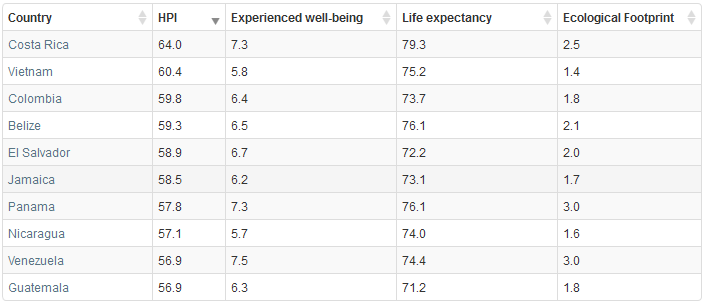
The highest ranking countries on the HPI are: Costa Rica, Vietnam, Belize, Colombia and El Salvador. See table below:

For more information about the HPI methodology, definitions and the complete list of ranked countries, please visit: The Happy Planet Index


Life Expectancy vs. Fertility Rates Worldwide 1960-2010

click to enlarge

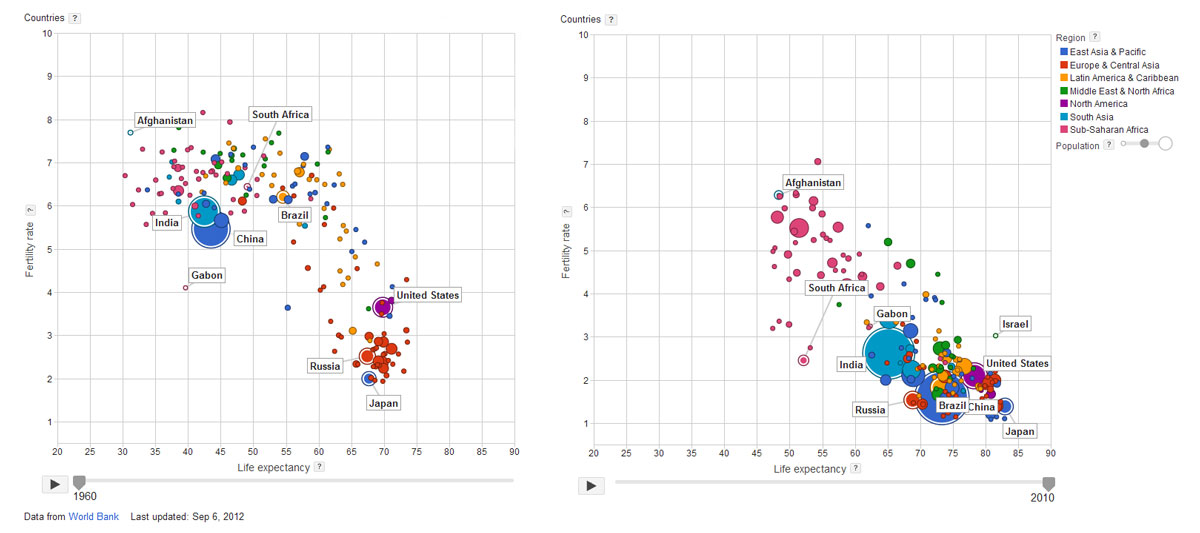
During the last fifty years, we have seen the gradual increase in life expectancy and the corresponding decrease in fertility rates worldwide. This is clearly the case of countries like China, India, the United States, Brazil, Japan, and Gabon, where dramatic improvements can be seen. On the other hand, countries like Russia, South Africa and Afghanistan, show moderate improvement.

It is very interesting to note, that although they have improved, a large cluster of African countries remain far from the overall trend, with lower life expectancy rates and higher fertility rates. For more information, check Google’s interactive bubble chart based on World Bank data.