Tag Archives: India

Key Commodities and Emerging Markets

emerging market dominate commoditiesCommodities are raw materials essential for the production of more complex products. Commodities fall into three large categories: agricultural, energy, and metals.

According to this visualization, emerging economies (Brazil, Russia, India Indonesia, China, South Africa, etc.) have the largest reserves of certain key energy and metal commodities such as oil, coal, copper, cobalt, iron ore, molybdenum, nickel, zinc, and aluminum.

Source: Business Insider: 36 Maps That Explain The Entire World


The 50 Largest Ports in the World

worlds 50 largest portsEvery day finished goods and commodities are transported  by sea in shipping containers from one port to another across the globe. Standard shipping containers measure 20 feet long by eight feet wide, hence they receive the name of “Twenty-foot Equivalent Units” or TEUs.

The largest port in the world is in Shanghai (China) which saw a volume of 31.74 million TEUs of cargo freight passing through its port in 2011. Shanghai is followed by Singapore (Singapore) which saw a volume of 29.94 million TEUs passing through its port for the same year. Singapore is followed by Hong Kong, Shenzhen (China), Busan (South Korea), Ningbo, Guangzhou, and Qingdao (China), Dubai Ports (United Arab Emirates), and Rotterdam (Netherlands), all in the top ten.

For the interactive map, that allows you to explore each one of the largest 50 ports in the world, visit: The Smithsonian: Interactive: The 50 Largest Ports in the World


Percentage of the Population Living on $2 or Less a Day

surviving on a few dollars per day worldMIT economists Abhijit V. Banerjee and Esther Duflo, conducted surveys in developing nations to see which countries survive on a few dollars per day. The cities or countries where people are known to live on meager dollar amounts on a daily bases are not that surprising, but the percentage of the population living under these conditions is.

In Udaipur and Hyderabad (India) a staggering 94% of the population survive on $2 or less per day. In Bangladesh, 69.4% go on $2 or less per day. In Ghana, 67.7% survive on $2 or less per day. In Guatemala, 64.8% of the population survive on $2 or less per day.

Source: GOOD: Living on Less


Crude Oil Exports and Imports by Country

crude net balance by countryVast quantities of crude oil are exported and imported each year. Some countries are net exporters (their oil exports are larger than their oil imports), and some are net importers (their oil imports are larger than their exports).

In this visualization by Data Driven Consulting, we can see that the United States was the largest net importer of crude oil in 2009. Other net importer countries include China, India, Japan, South Korea, Germany, Belgium, Italy, UK, Spain, Singapore, and Australia.

Among the net exporters of crude oil we find Russia, Saudi Arabia, Iran, Iraq, Norway, Venezuela, Mexico, and Canada.

For the full-size interactive dashboard, visit: Tableau Public: Exporters and Importers


Number of Nuclear Tests Since 1945

North Korea conducted its third nuclear test on February, 2013. Two nuclear test preceded this one, the first in 2006, and the second in 2009.

However, the nation that has performed the largest number of nuclear tests since 1945 is the United States, a total of 1,032. In the same period, the USSR/Russia performed a total of 715 nuclear tests, and France performed a total of 210 nuclear tests.

Source: Statista: North Korea Conducts Third Nuclear Test


Total Carbon Emissions by Country

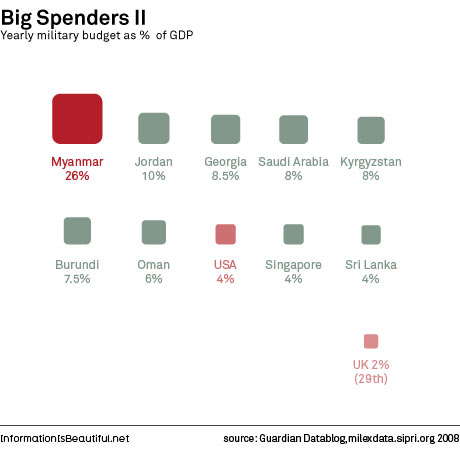
The Kyoto Protocol is an international treaty that seeks the reduction of greenhouse gases that contribute to global warming by setting emission reduction targets for industrialized nations. The Kyoto Protocol was signed on December 11, 1997 in Kyoto (Japan) by 191 countries. The United Stated signed the treaty, but later it did not ratify it.

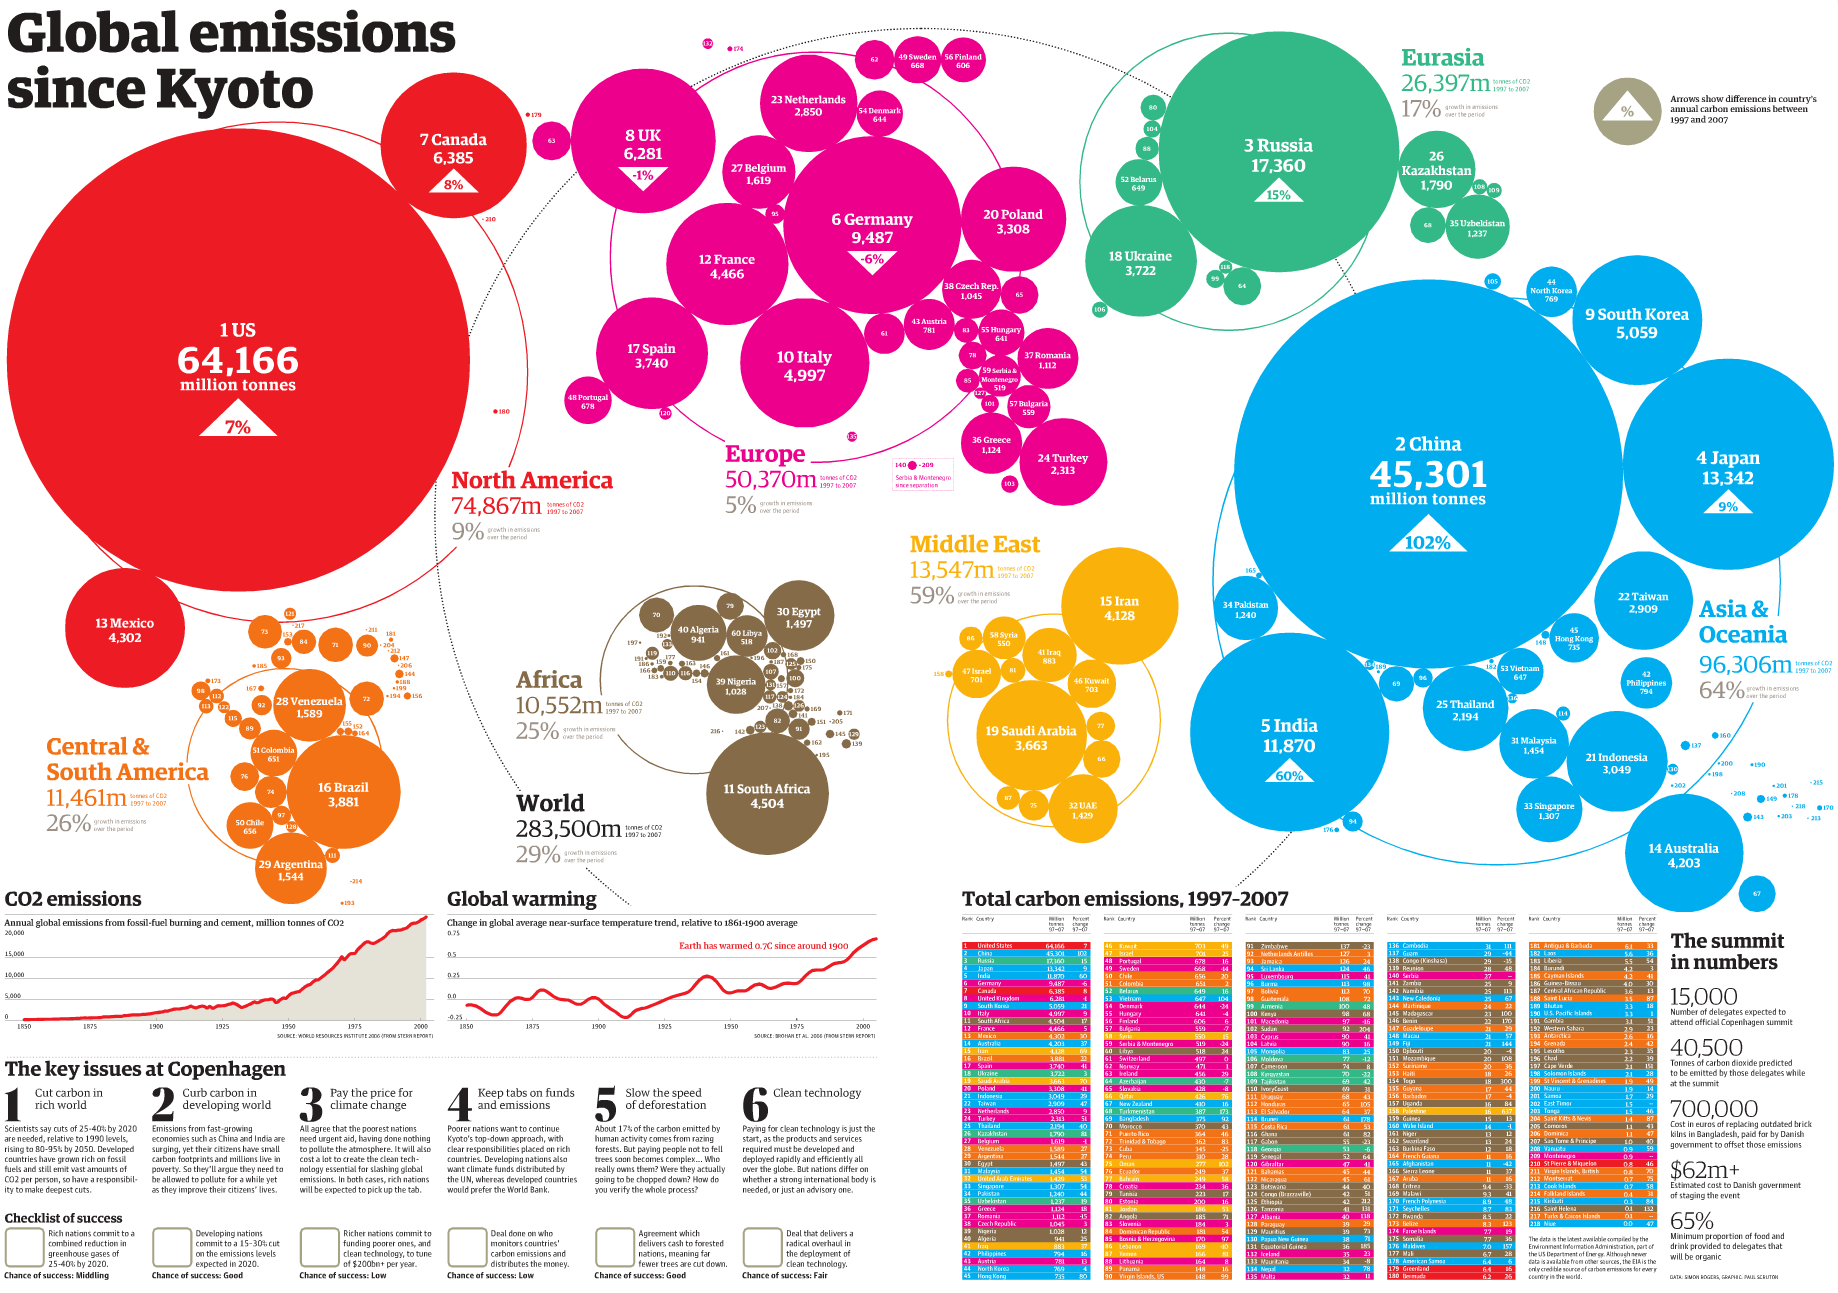
This visualization by The Guardian shows total carbon emissions by country between 1997 and 2007, ten years since the protocol was signed.

The United States is the country that has produced the largest amount of carbon emissions (64,166 million tonnes) in the period 1997-2007 followed by China, Russia, Japan, India, and Germany.

Asia and Oceania combined are the regions with the highest carbon emissions produced in the same period (96,306 million tonnes). Asia and Oceania are followed by North America (U.S., Canada, and Mexico) with carbon emissions of the order of 74,867 million tonnes, and Europe with carbon emissions at 50,370 million tonnes as of 2007.
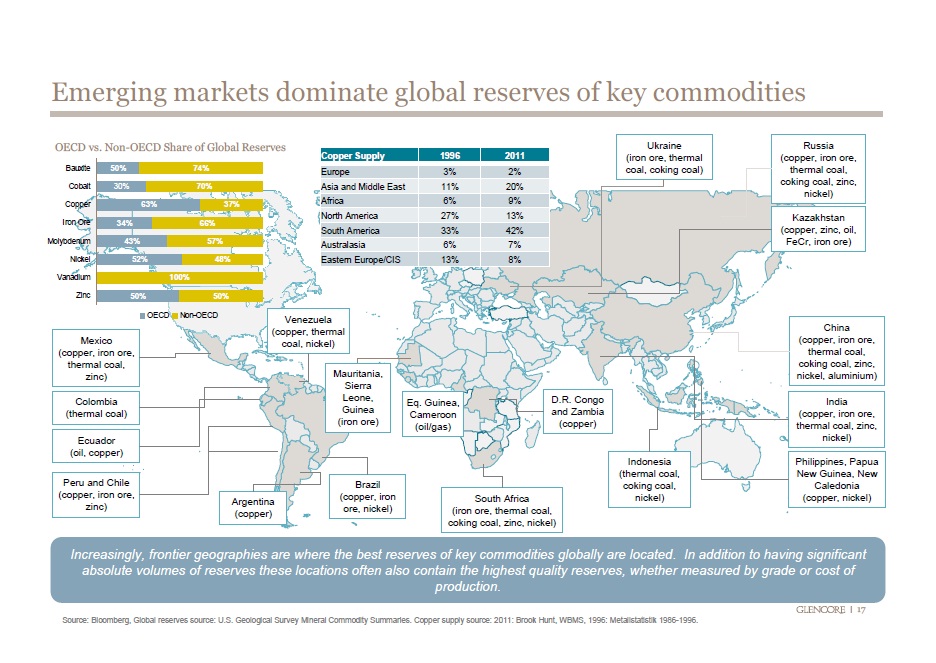
 

Male Gender Preference Globally

In this day and age, it is still surprising that in most parts of the world, there is still a preference for sons over daughters. It is even more surprising when you are talking about developed nations such as Spain, Portugal, Switzerland, Canada, Australia, New Zealand, Japan, and South Korea.

Other nations where the preference of sons overs daughters is extremely abnormal include China, India, Myanmar, Vietnam, and Malaysia among others.

Resource: Women Stats: Map – Son Preference and Sex Ratios


Paid Maternity Leave Worldwide

Many developed nations provide paid maternity leave to their female employees. This is not the case for the United States.

According to this visualization by the Huffington Post, the UK provides the highest number of paid maternity leave days, 280 with 90% pay. Brazil, China, France, Germany, India, Indonesia, Mexico, Netherlands, Russia, South Korea, and Spain, offer maternity leave with 100% pay.

In the U.S., parents are guaranteed their jobs for 90 days while on maternity or paternity leave, but without pay. Other countries that do not provide paid maternity leave include Lesotho, Swaziland, and Papua New Guinea, all developing nations.


Military Spending Worldwide

According to an article of The Guardian, in 2008 the defense budget of the United States was $607 billion, ten times that of China and the UK, fifteen times that of Germany, seventeen times that of Russia, and twenty five times that of India. In fact, the defense budget of the top nine countries combined (shown in the first graphic) adds up to $377 billion, or 62% of the military spending of the U.S. Those numbers would make the U.S. the top country in defense spending in the world.

But, if one looks at defense spending numbers as a percentage of the GDP, we have a different story. In that case, Myanmar becomes the top defense spender with a military budget of 26% of its GDP, followed by Jordan, Georgia and Saudi Arabia. The U.S. moves to number eight, with a military budget of 4% of its GDP. Large military spending by these nations is due to different factors. Some of these countries are dictatorships, some are monarchies. Others need to actively protect their borders from foreign aggression.

To read the article from The Guardian, visit: The Guardian: Data Store – Show and Tell, Information is beautiful: war games


Unsafest Countries for Women

click to enlarge

This map created as part of the WomenStats Project, is aimed at determining the relationship of security and behavior of states and the security of women living in those states. It has built a global database of the status of women worldwide, with data from 174 countries.

As seen in the map for the year 2009, countries where women experience lack of physical security include India, Pakistan, Afghanistan, Indonesia and other Muslim countries in Asia and Africa. In the Americas, Peru seems to be the place were women lack physical security the most. The darkest color in the map indicates the highest degree of lack of physical security for women.

For more information visit: WomanStats Database