Tag Archives: GDP

The United States vs. China

US and China compared - final graphic
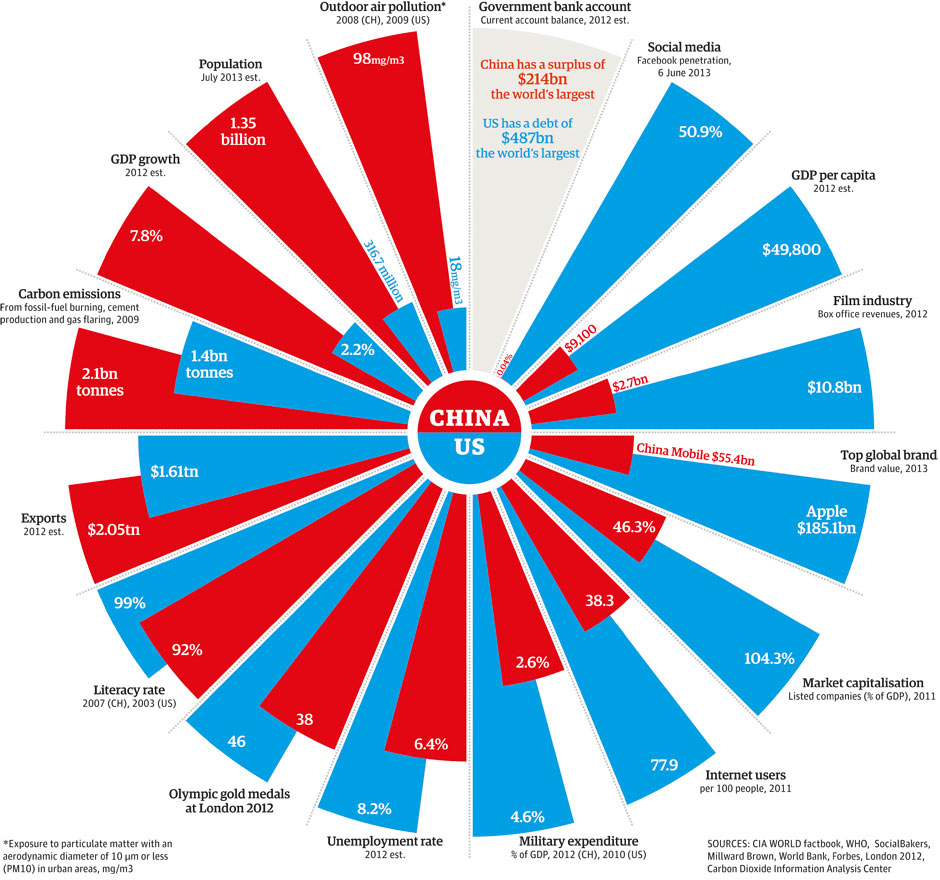
The Guardian created this comparison of the U.S. and China, comparing several indicators such as GDP growth, GDP per capita, carbon emissions, exports, literacy rate, unemployment rate, military expenditure, outdoor pollution, to name a few.

The US is ahead of China in terms of literacy rate, number of internet users, military expenditure as a percentage of GDP, unemployment rate, GDP per capita, market capitalization, and social media. On the other hand, China is ahead of the U.S.  in terms of exports, GDP growth, number of people, carbon emission, and outdoor pollution.

While the U.S. has the largest deficit in its current account, China has the largest surplus.

Wealth Comparison for the Years 1500 and 2015

wealth year 1500

wealth year 2015Comparing the levels of wealth per person for the years 1500 and 2015, as shown in these two maps, it is interesting to see how economic power has shifted from some nations to others.

Back in the 1500s, economic power was held by a majority of European nations leaded by Italy. China ranked number 23, India 53, and Japan 61. North America’s wealth was negligible compared to Europe’s, but the African region enjoyed more wealth than they do today.

A forecast for the year 2015 places Taiwan, Hong Kong, and Singapore at the top in GDP per capita. Some European nations are still wealthy, such is the case of Malta, Luxembourg, Norway, and Ireland, but Italy is not in the lead anymore. Japan’s wealth per capita has increased, and so has the United States’, but the wealth of African countries has become the lowest worldwide.

Source: Global Finance: Wealth Distribution and Income Inequality by Country


Women in the Workforce by Country

women and equality worldIt has been said, that if women participated in the workforce more actively, like their male counterparts, the Gross Domestic Product (GDP) of those countries would be higher.

However, most countries, including some developed nations do not have policies in place that support women’s participation in the workforce, such as access to education, credit, employment, paid maternity leave or child care.

Countries with the highest economic success for women (measured in terms of equality of pay, degree of inclusion in the workforce, and career advancement), that offer the best policies for supporting women in the workforce include Norway, Australia, Sweden, Finland, Germany, Belgium, and Iceland.

Countries with the lowest degree of economic success that have few policies (or none) that support women in the workplace include Chad, Sudan, Yemen, Pakistan, Syria, Saudi Arabia, among others.

women and equality world 2Some interesting facts about the success of women in the workplace and the policies in place to support them in certain countries can be seen in the graphic above.

Source: Harvard Business Review: Vision Statement: Women and the Economics of Equality


North Korea vs. South Korea

In this visualization created by The Guardian, we can see how North Korea compares to South Korea in terms of population, Gross Domestic Product (GDP), life expectancy, freedom of the press, military spending, internet connectivity, infant mortality, among other indicators.

North Korea is a poor country with half the population of South Korea. It is one of the worst countries in terms of corruption and freedom of the press. Its military spending constitutes approximately 22.3% of its GDP, compared to 2.8% for South Korea.

Additional resource: IndexMundi: South Korea vs. North Korea – Country Comparisons


Human Development Index 2012

The Human Development Index (HDI) is a composite measure that includes three indicators: life expectancy at birth, level of education attained, and income. The HDI is an alternative to the purely economical GDP, that quantifies economic growth only. Thus, the HDI provide a way to gauge the development of a country. The HDI for 2012 includes 187 countries.

The HDI ranks countries according to their degree of development using a scale from 0 to1, 0 being the least developed and 1 being the most developed country.

In the HDI map above, published by the Brazilian media site Globo.com we find that Norway has a score of 0.955, ranking number one as the most developed country (color green). Norway is followed by Australia, the U.S., the Netherlands, Germany, New Zealand, among others.

At the other end of the spectrum we find the least developed nations (color purple), including the majority of African nations, Pakistan, Afghanistan, Myanmar, Bangladesh, Nepal, and Papua New Guinea.


Education Expenditure vs. Military Expenditure

This visualization by the Deutsche Welle, shows how much is spent in education versus how much is spent in the military, as a percentage of the GDP, worldwide.

The dividing line denotes equal expenditure in both education and the military. Most countries seem to be concentrated on the left side of the line, meaning they spend more in education than in defense. Countries in this group include the United States, Iran, Portugal, Italy, Germany, Canada, etc. The country that immediately grabs our attention is Cuba, showing the highest expenditure in education (about 13% of its GDP) relative to its expenditure in defense (about 4% of its GDP). Lesotho follows Cuba very closely.

On the right side of the dividing line, we have the nations spending more on the military relative to education spending. Countries in this group include: Somalia, Sudan, Syria, Israel, etc. It is worth noting that Oman shows the highest expenditure in defense (close to 12% of its GDP) relative to its expenditure in education (about 4% of its GDP). Saudi Arabia and Qatar follow Oman closely.

For more visualizations of education indicators worldwide, visit: Deutsche Welle: In Numbers: Education Around the World


Military Spending Worldwide

According to an article of The Guardian, in 2008 the defense budget of the United States was $607 billion, ten times that of China and the UK, fifteen times that of Germany, seventeen times that of Russia, and twenty five times that of India. In fact, the defense budget of the top nine countries combined (shown in the first graphic) adds up to $377 billion, or 62% of the military spending of the U.S. Those numbers would make the U.S. the top country in defense spending in the world.

But, if one looks at defense spending numbers as a percentage of the GDP, we have a different story. In that case, Myanmar becomes the top defense spender with a military budget of 26% of its GDP, followed by Jordan, Georgia and Saudi Arabia. The U.S. moves to number eight, with a military budget of 4% of its GDP. Large military spending by these nations is due to different factors. Some of these countries are dictatorships, some are monarchies. Others need to actively protect their borders from foreign aggression.

To read the article from The Guardian, visit: The Guardian: Data Store – Show and Tell, Information is beautiful: war games


How Does Your Country Compare to U.S. States?

These interactive maps from the Economist provide an interesting comparison between different countries and US states.

Using the criteria of GDP (Gross Domestic Product), the economy of California is approximately the size of Italy, Texas the size of Russia, Florida the size of the Netherlands, and Alabama the size of Nigeria.

Using the criteria of Population, California is approximately the size of Poland, Washington  the size of Lebanon, Arizona the size of Libya, and Minnesota the size of Finland, to name a few.