Category Archives: Economics

China at the Top of Renewable Energy Investment

china leads energy investment
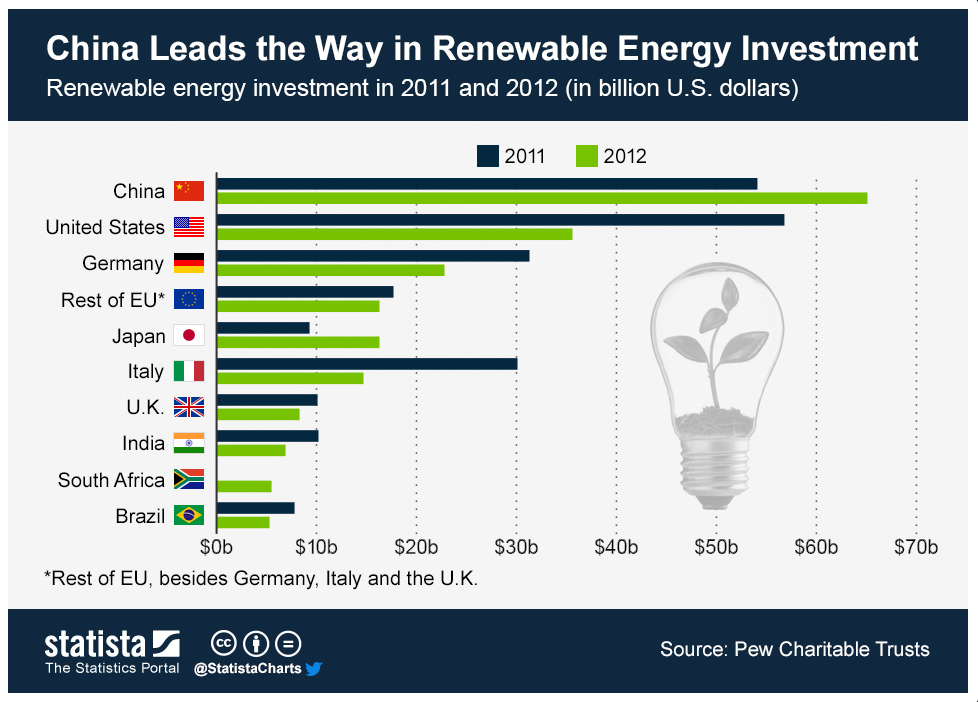
In 2012 China’s investment in renewable energy surpassed the investment by the United States for the previous year and for the same year. In fact, China’s is ahead every other nation including Germany, Japan, and Italy.

China’s investment in renewable energy exceeded $60 billion for 2012, compared to an estimated $36 billion in the United States, and $23 billion in Germany for the same year.

Source: Statista: China Leads the Way in Renewable Energy Investment


Oil Production and Consumption by Country

oil production and consumption since 1965When it comes to oil production and consumption, countries have a very close relationship of interdependence with each other. Some countries consume more oil than what they produce relying on imports to satisfy their internal demand. Others, consume less than what they produce, being able to export oil to nations that need it.

Oil consumption (yellow) for the United States, for example, was larger than its production (grey) for 2012, 18.55 mb/d (million barrels per day) compared to 8.9 mb/d, importing more than double its production to satisfy the gap in internal demand. Other nations with oil consumption higher that oil production include China, Brazil, Australia, India, UK, and Indonesia.

In contrast, oil consumption for Saudi Arabia for 2012 is estimated at 2.94 mb/d, while its production reached 11.53 md/d, exporting its oil surplus to the rest of the world. Other nations whose oil production exceeds its oil consumption include Canada, Mexico, Venezuela, Norway, Russia, Kuwait, United Arab Emirates, and Qatar.

Source: Winston Smith Labs: Global Oil Production and Consumption since 1965 [Interactive Map/Graph]


The Quality of Democracy by Country

democracy ranking worldmap 2012Global Democracy Ranking released the Democracy Ranking for the year 2012, which shows the quality of democracy around the world.

Several indicators were used to calculate the Global Democracy Ranking. Those indicators were selected from a vast variety of dimensions such as politics, economy, environment, gender equality, education, health, and knowledge.

As seen in the map above, countries ranked at the top (dark green), those with the highest quality of democracy include Norway, Sweden, Finland, Switzerland, Denmark, Netherlands, New Zealand, Germany, Ireland, and Austria. In contrast, we find countries where democracy is at serious risk or where it is no longer a viable system (brown). Among these countries we have Yemen, Syria, Libya, Togo, Guinea-Bissau, China, Pakistan, Egypt, Nigeria, and Haiti.

Source: Global Democracy Ranking: Democracy Ranking 2012


Worldwide Remittance Flows

world remittance flows 2012Remittances, or money sent by migrant workers to their home countries, have increased since the year 2000. Although, they temporarily decreased after the economic crisis back in 2008, they recovered in 2010 and continued to rise. Remittances increased from $204 billion back in 2000 to $540 billion in 2012.

Countries with the highest remittance inflows include India ($71 billion), China ($62 billion), Mexico, the Philippines, Nigeria, Egypt, and France. Only nine countries saw a reduction in remittance inflows, among them Greece and Turkey which experienced the steepest decline.

For the interactive map, please visit: Tages Woche: The incredible rise of migrants’ remittances


Basic Salary of Lawmakers by Country

basic salary of lawmakers by country 2013How much lawmakers are paid is a sensitive issue especially in times of economic austerity, or in countries where the majority of the population lives in extreme poverty conditions.

In this chart prepared by The Economist, we can see how much lawmakers are being paid in different countries across the globe in U.S. dollars (left), and as a ratio of the gross domestic product (GDP) per capita (right).

In Nigeria, for example, lawmakers receive a basic salary of $189,000, 116 times the country’s GDP per capita. In Kenya a lawmaker makes a basic salary of $74,500, 76 times the country’s GDP per capita. Other countries were lawmakers receive the heftiest salaries include Ghana, Indonesia, South Africa, Brazil, Thailand, and India. It is worth pointing out that most of these countries are some of the poorest in the world.

In comparison, in the wealthiest nations a lawmaker’s salary as a ratio of GDP is much smaller. In Britain, that ratio is 2.7 of the GDP per capita.


The Failed States Index 2013

failed state index 2013Fund For Peace just released the Failed State Index (FSI) 2013. The FSI measures the level of risk in each country using a series of risk indicators such as mounting demographic pressures, massive movement of refugees, uneven economic development, poverty, legitimacy of the state, progressive deterioration of human services, violation of human rights, violation of the rule of law, security apparatus, intervention of external actors, etc. The FSI is calculated for a total of 178 countries.

Nations ranking at the top for failed states (red) include Somalia, Congo, Sudan, and South Sudan. Unfortunately, most of the world’s nations seem to be under a warning (orange) for failed states, from Africa to Asia to Latin America.

For the complete list of countries, rankings and scores, please visit: Fund For Peace: Failed State Index (FSI) 2013


The United States vs. China

US and China compared - final graphicThe Guardian created this comparison of the U.S. and China, comparing several indicators such as GDP growth, GDP per capita, carbon emissions, exports, literacy rate, unemployment rate, military expenditure, outdoor pollution, to name a few.

The US is ahead of China in terms of literacy rate, number of internet users, military expenditure as a percentage of GDP, unemployment rate, GDP per capita, market capitalization, and social media. On the other hand, China is ahead of the U.S.  in terms of exports, GDP growth, number of people, carbon emission, and outdoor pollution.

While the U.S. has the largest deficit in its current account, China has the largest surplus.

Wealth Comparison for the Years 1500 and 2015

wealth year 1500

wealth year 2015Comparing the levels of wealth per person for the years 1500 and 2015, as shown in these two maps, it is interesting to see how economic power has shifted from some nations to others.

Back in the 1500s, economic power was held by a majority of European nations leaded by Italy. China ranked number 23, India 53, and Japan 61. North America’s wealth was negligible compared to Europe’s, but the African region enjoyed more wealth than they do today.

A forecast for the year 2015 places Taiwan, Hong Kong, and Singapore at the top in GDP per capita. Some European nations are still wealthy, such is the case of Malta, Luxembourg, Norway, and Ireland, but Italy is not in the lead anymore. Japan’s wealth per capita has increased, and so has the United States’, but the wealth of African countries has become the lowest worldwide.

Source: Global Finance: Wealth Distribution and Income Inequality by Country


World Production of Rare Earth Metals

the future global supply of rare earth elementsRare earth metals or rare earth elements are a collection of seventeen chemical elements located at the bottom of the periodic table. They are key elements in the manufacture of high technology components, hybrid cars, solar panels, lasers, electronics, etc.

As of 2010, China produced 97% of the total world production of rare earths, or 130,000 metric tons, followed by India (2%), Brazil (0.42%), and Malaysia (0.27%).

The estimated demand for rare earths for 2015 will increase 54% compared to the demand in 2010.

Source: GOOD: Infographic: The Future Global Supply of Rare Earth Elements

See also: IndexMundi: Commodities Glossary – Rare Earth Metals


Global Attitudes About the Economy

global attitudes about the economyA survey conducted by the Pew Research Center in 39 nations, regarding attitudes about the state of the economy in the respondents’ respective countries, yielded interesting results.

Respondents in emerging economies are the most optimistic. A median of 53% believe their economy is doing well, specially in China and Malaysia. In contrast, respondents in developed economies are the most pessimistic. A median of only 24% say their economy is doing well. European nations such as Greece, Italy, Spain, and France are the most pessimistic of all.

In the case of developing economies, some are somewhat optimistic (Philippines and Bolivia), and other not so much (Tunisia and Lebanon).

Source: Pew Research Global Attitudes Project: Widespread Dissatisfaction with Economy

Read full report: Pew Research Global Attitudes Project: Economies of Emerging Markets Better Rated During Difficult Times