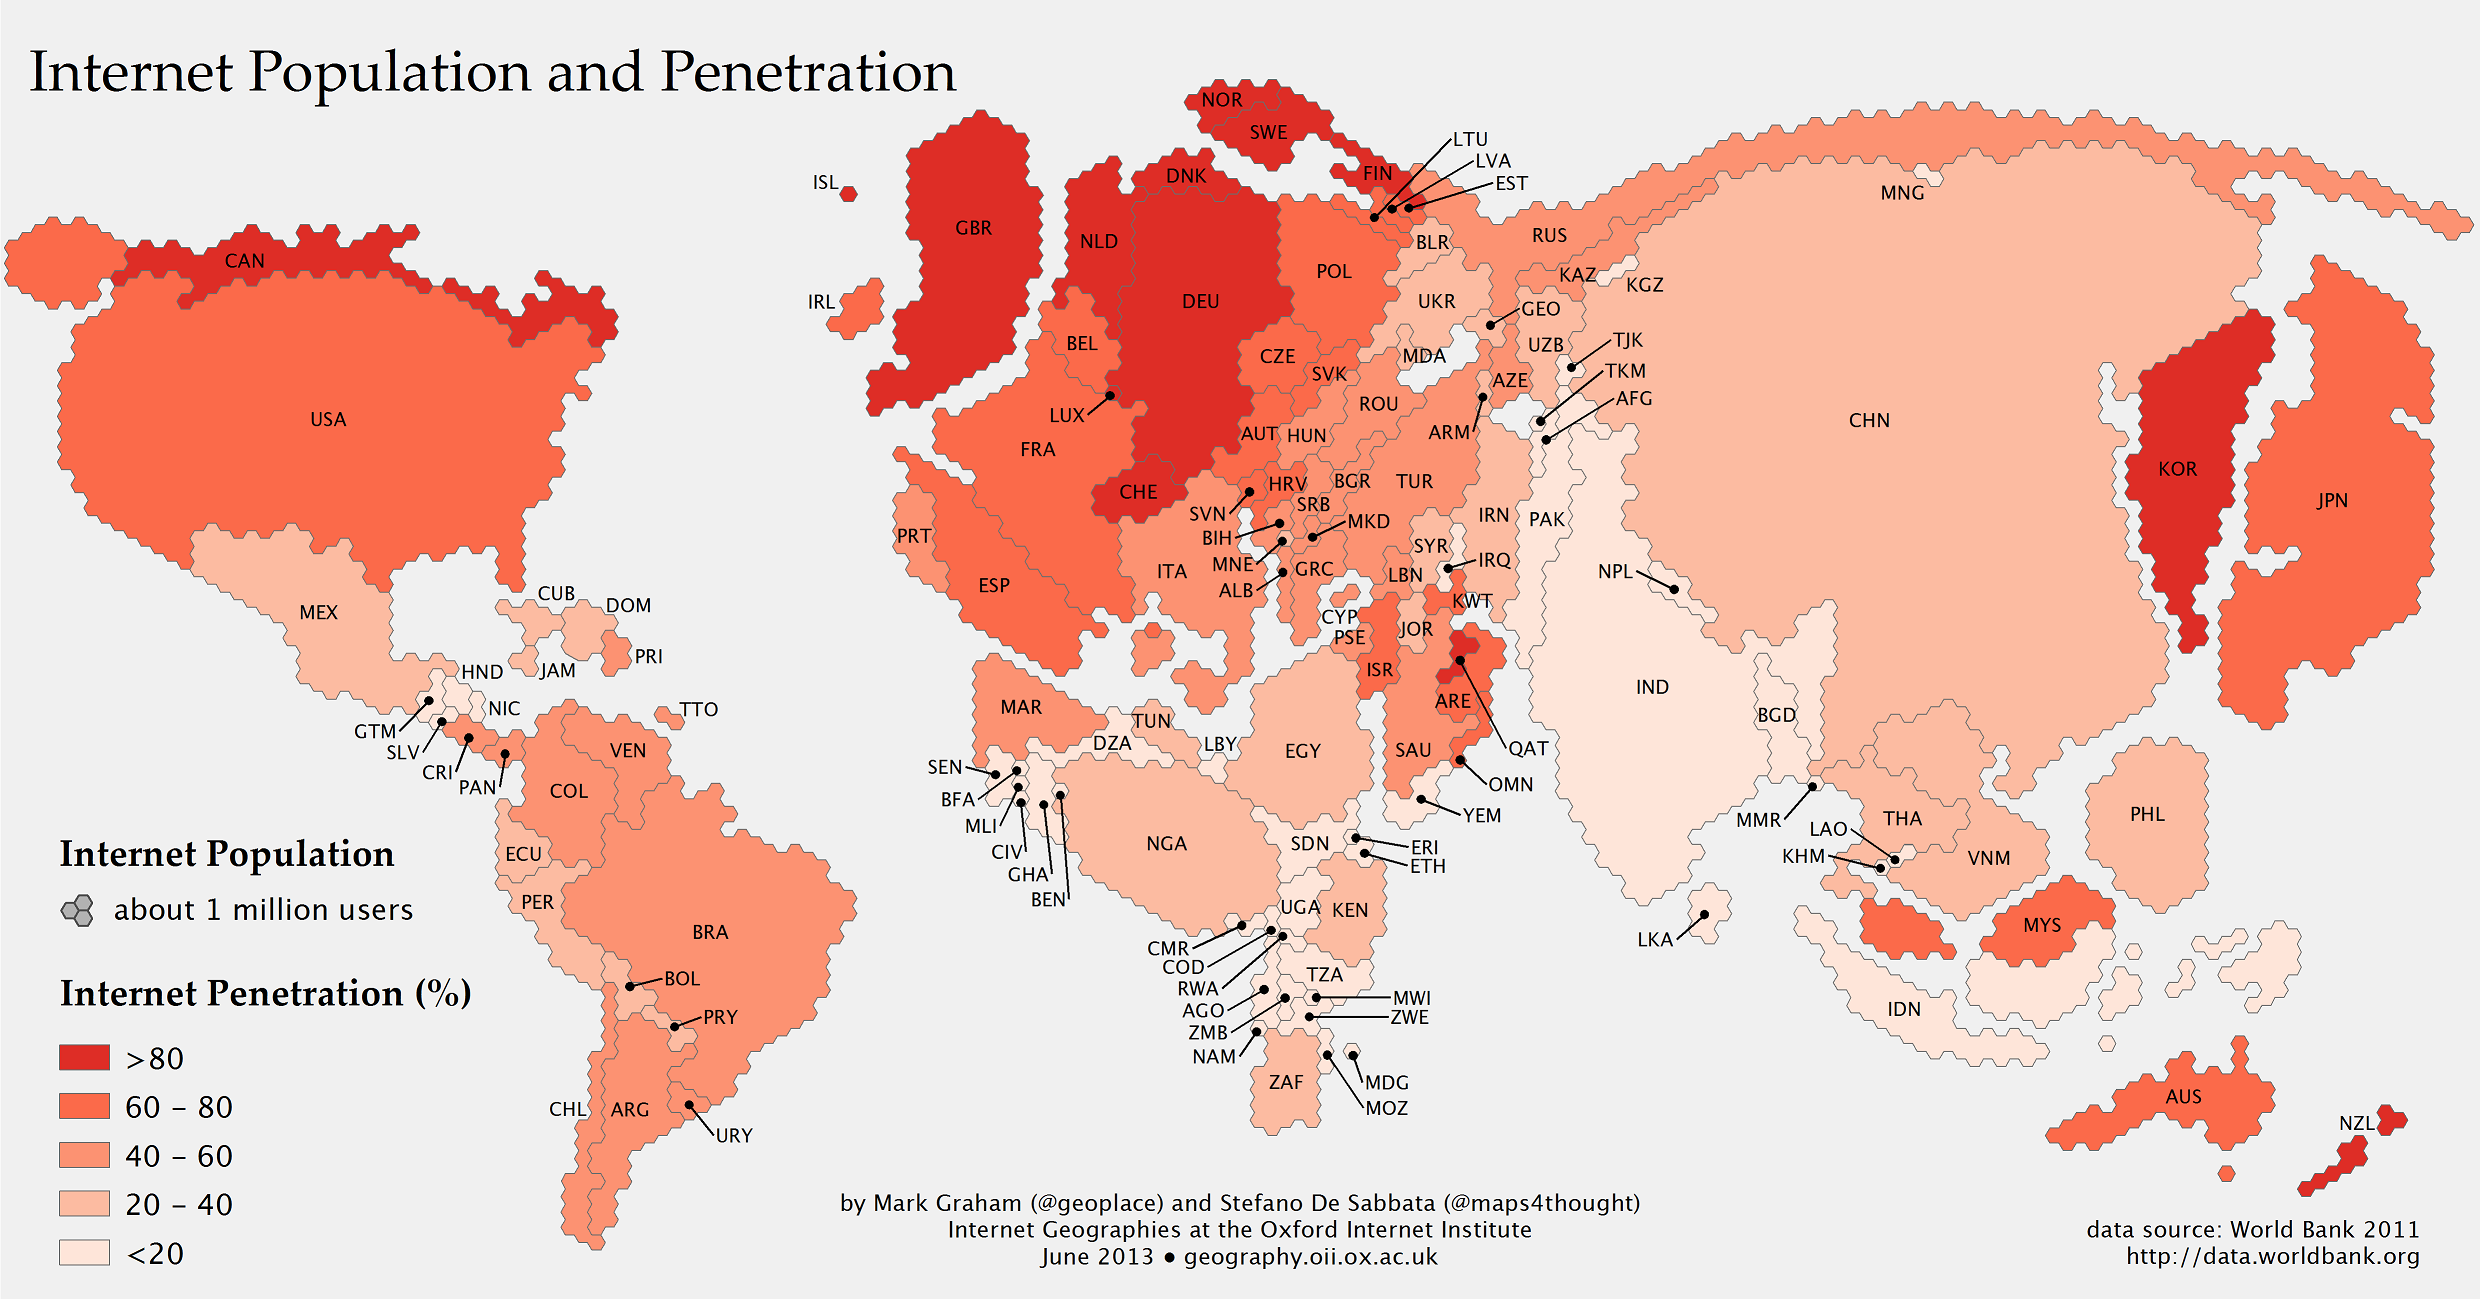
The United States vs. China

US and China compared - final graphicThe Guardian created this comparison of the U.S. and China, comparing several indicators such as GDP growth, GDP per capita, carbon emissions, exports, literacy rate, unemployment rate, military expenditure, outdoor pollution, to name a few.

The US is ahead of China in terms of literacy rate, number of internet users, military expenditure as a percentage of GDP, unemployment rate, GDP per capita, market capitalization, and social media. On the other hand, China is ahead of the U.S.  in terms of exports, GDP growth, number of people, carbon emission, and outdoor pollution.

While the U.S. has the largest deficit in its current account, China has the largest surplus.

World Internet Users by Region

Of the 7 billion people in the world, only 2.4 billion are connected to the Internet, that is roughly 34% of the population as of 2012.

Internet penetration is the highest in North America (79%), followed by Oceania (68%), Europe (63%), and Latin America (43%).

Source: Statista: Only a Third of the World’s Population Is Online


Internet Connectivity in the United States

As part of the PBS series America Revealed, this aerial visualization shows the patterns of internet distribution in the United States. We can see that the regions with highest levels of internet connectivity include the Northeast, and parts of the South and Midwest, followed by the Pacific West.

For additional interesting aerial visualizations, such as the distribution of the unemployed, electricity network routes, public transportation paths, U.S. imports and exports of beef patterns, the distribution of the population in towns and cities, etc., visit: The Roosevelt’s – Aerial Data Visualisation Reveals Life In The United States.

Map of Internet Activity

click here to see the animation

Someone hacked thousands of computers all around the world in order to create a map of internet activity in the course of a day.

In this map from FastCo.Design, the red dots show peak internet activity around the world at different times of the day, while the blue dots show base traffic. Some interesting conclusions point to the fact that nighttime affects the U.S. and Europe very little, due to the fact that permanent internet connectivity is available.

Real-Time Twitter Activity Mapped

This visualization from Tweetping.net shows Twitter activity in real time, worldwide. Using Twitter’s API, Tweetping.net tracks the total number of tweets, including word and character count, generated per second. It also tracks the latest mentions and hashtags used, categorized by region. The lit areas show where Twitter activity is happening at the moment.

For more, visit: The Atlantic: What Twitter Really Looks Like


World Leaders on Twitter

click to enlarge

Heads of state have realized the importance of being active in social media. The number of heads of state with Twitter accounts increased 78% in 2012 with respect to 2011, according to a report by the Digital Policy Council. Roughly 75% of them have Twitter accounts. According to a Washington Post article, world leaders that tweet more come from countries that have a tradition of transparency. 63% of the them come from “politically stable” countries.

President Barack Obama (@BarackObama) has the largest number of followers on Twitter for a head of state, with more than 25 million followers. In second place comes Venezuelan president Hugo Chavez (@chavezcandanga) with 3.8 million followers. Turkish president Abdullah Gül (@cbabdullahgul) comes in third place with 2.6 million followers, and Queen Rania of Jordan (@QueenRania) is fourth with 2.5 million followers. Russian prime minister Dmitry Medvedev (@MedvedevRussiaE) comes in fifth place, and Brazilian president Dilma Rouseff (@dilmabr) comes in sixth place.

Other countries with leaders who have Twitter accounts include, Germany, India, Morocco, Tunisia, India, Argentina, Somalia among others. Even Pope Benedict XVI (@Pontifex) has Twitter presence.

For more information visit: Digital Daya: World Leaders on Twitter – Ranking Report, December 2012.


Mobile Phone Penetration in Brazil

The cell phone penetration rate in Brazil as of 2007 was 63.6%, according to the Brazilian National Telecommunications Agency. With a population of almost 200 million people, Brazil is one of the World’s largest markets for mobile phone manufacturers. The chart below shows mobile phone penetration in Brazil from 2002 thru 2007.

Mobile phone penetration in Brazil 2002-2007

Source: National Telecommunications Agency of Brazil

See also: Mobile phone penetration in China and in India

Mobile Phone Penetration in India

According to the Department of Telecommunications of India, there were 346.9 million wireless telephones in India as of December 2008. Using a total population of 1,147,995,904 (July 2008 estimate), the penetration rate of cell phones was 30.2%. For comparison purposes, the penetration rate as of December 2007 was only 20.7%. In other words, the number of mobile phones in India increased by 113 million in 12 months, an astounding 48.5% growth rate.

You may also want to compare India’s mobile phone penetration to China’s mobile phone penetration.

Mobile Phone Adoption in China

Cell phone penetration in China as of 2006 was only 35.3 handsets per 100 people. Considering that the population of China is over 1.3 billion, we can estimate that there are at least 463 million mobile handsets in operation. More interestingly, given that mobile phone penetration rates in more advanced countries are over 75%, as China continues to develop the market for cell phones will more than double in size.

The chart below shows mobile phone adoption in China from 2002-2006.

Mobile phone adoption in China 2002-2006

Source: National Bureau of Statistics of China