Category Archives: India

Oil Production and Consumption by Country

oil production and consumption since 1965
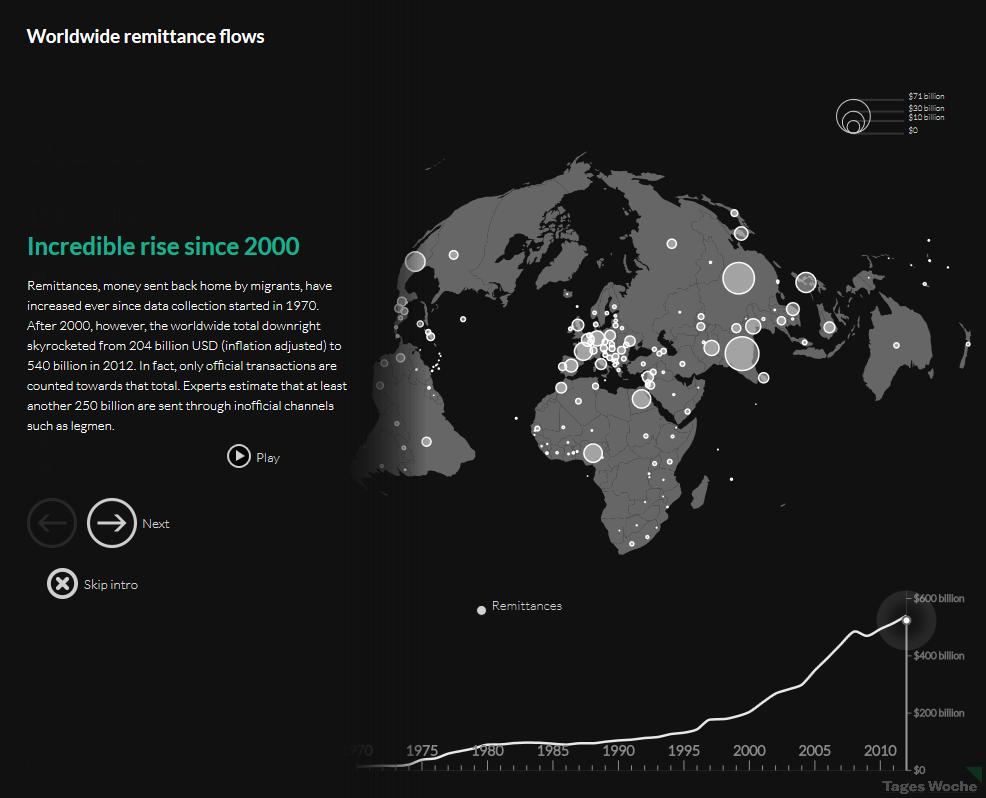
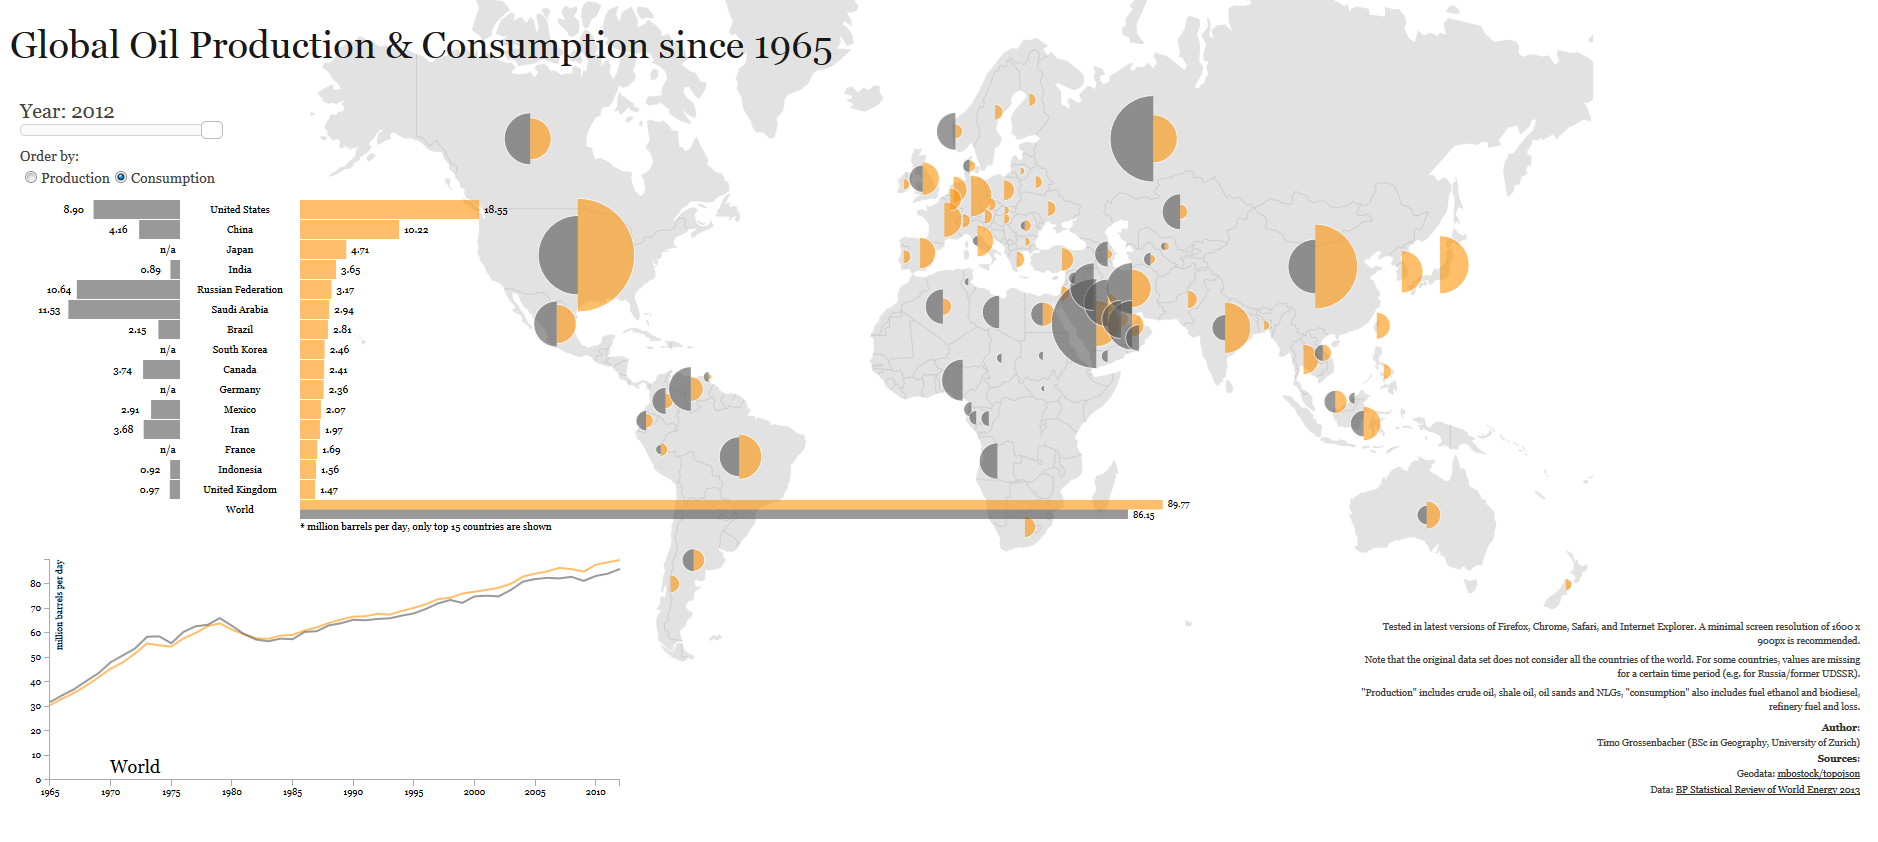
When it comes to oil production and consumption, countries have a very close relationship of interdependence with each other. Some countries consume more oil than what they produce relying on imports to satisfy their internal demand. Others, consume less than what they produce, being able to export oil to nations that need it.

Oil consumption (yellow) for the United States, for example, was larger than its production (grey) for 2012, 18.55 mb/d (million barrels per day) compared to 8.9 mb/d, importing more than double its production to satisfy the gap in internal demand. Other nations with oil consumption higher that oil production include China, Brazil, Australia, India, UK, and Indonesia.

In contrast, oil consumption for Saudi Arabia for 2012 is estimated at 2.94 mb/d, while its production reached 11.53 md/d, exporting its oil surplus to the rest of the world. Other nations whose oil production exceeds its oil consumption include Canada, Mexico, Venezuela, Norway, Russia, Kuwait, United Arab Emirates, and Qatar.

Source: Winston Smith Labs: Global Oil Production and Consumption since 1965 [Interactive Map/Graph]


Worldwide Remittance Flows

world remittance flows 2012Remittances, or money sent by migrant workers to their home countries, have increased since the year 2000. Although, they temporarily decreased after the economic crisis back in 2008, they recovered in 2010 and continued to rise. Remittances increased from $204 billion back in 2000 to $540 billion in 2012.

Countries with the highest remittance inflows include India ($71 billion), China ($62 billion), Mexico, the Philippines, Nigeria, Egypt, and France. Only nine countries saw a reduction in remittance inflows, among them Greece and Turkey which experienced the steepest decline.

For the interactive map, please visit: Tages Woche: The incredible rise of migrants’ remittances


The Failed States Index 2013

failed state index 2013Fund For Peace just released the Failed State Index (FSI) 2013. The FSI measures the level of risk in each country using a series of risk indicators such as mounting demographic pressures, massive movement of refugees, uneven economic development, poverty, legitimacy of the state, progressive deterioration of human services, violation of human rights, violation of the rule of law, security apparatus, intervention of external actors, etc. The FSI is calculated for a total of 178 countries.

Nations ranking at the top for failed states (red) include Somalia, Congo, Sudan, and South Sudan. Unfortunately, most of the world’s nations seem to be under a warning (orange) for failed states, from Africa to Asia to Latin America.

For the complete list of countries, rankings and scores, please visit: Fund For Peace: Failed State Index (FSI) 2013


Violence Against Women by World Region

violence against womenIn this chart published by The Economist we look at two sets of data about violence against women.

The first one shows that more than a third (39%) of homicides of women around the world are committed by a previous or current partner. The numbers are specially shocking for South East Asia (Cambodia, Laos, Myanmar [Burma], Thailand, Vietnam, Brunei, Malaysia, East Timor, Indonesia, Philippines, and Singapore). The numbers are also high for Latin American and African countries.

The second set of data shows that 30% of women around the world have experienced physical or sexual violence during their lifetime by a former or current partner. The numbers are the highest for Central African countries (Burundi, Central African Republic, Democratic Republic of the Congo, and Rwanda),  followed by countries in West Africa (Benin, Burkina Faso, Ivory Coast, Ghana, Liberia, Nigeria, Senegal, Sierra Leone, etc.), South Asia (Afghanistan, Bangladesh, Bhutan, India, Maldives, Nepal, Pakistan, and Sri Lanka), the Andean region of South America (Colombia, Venezuela, Ecuador, Peru, and Bolivia), the Middle East, and North Africa.


Global Carbon Footprint by Country

carbon footprint by countryThis original visualization by Stanford Kay shows total carbon emissions by country. Using different colors to differentiate each region, the size of the circle depicts the carbon footprint of each country.

Countries with the largest carbon footprint include China, United States, Russia, India, Japan, Germany, South Korea, Australia, UK, Iran, Saudi Arabia, Brazil, Taiwan, Ukraine, France, and Spain.


Extradition Treaties of the U.S. with Other Countries

american extradition treatiesAn estimated 100 countries have signed bilateral extradition treaties with the United States, including all Latin American countries, Western European countries, Egypt, India, Australia, and New Zealand to name a few. Some 60 nations including China, Russia, several Middle Eastern and African countries have not. However, even if some countries signed extradition treaties they can still refuse to hand an individual over to the U.S. if that person is seeking asylum or if he/she would face the death penalty.

Source: The Economist: Daily Chart: Where can he go?


Male and Female Literacy Rates by Country

global literacy ratesLiteracy rate is defined as the number of people 15 years or older who can read and write. According to a study published by the Oxford Internet Institute at University of Oxford, global literacy rate is 82%. While the literacy rate for men is 87%, the rate for women is 77%.

Looking at data per continent, we find that countries in the Americas are highly literate, 99% for both men and women in the United States, and 97% for both men and women in Argentina. European countries show high literacy rates as well, above 91% for both men and women.

Many nations in Asia also show high literacy rates, except for countries like India, certain neighboring countries and countries in the Middle East, where the literacy rates are even lower for women.

Most African countries have very low literacy rates, with few exceptions: South Africa, Lesotho, Kenya, and Namibia.


Consumption of Spirits by Country

highest consumption of spiritsThe Economist compiled a visualization of the highest consumption of selected spirits worldwide. The selected spirits include vodka, rum, scotch whiskey, gin, and tequila.

The largest consumer of vodka is Russia, followed by the United States, Ukraine, Poland among others. The largest consumer of rum is India, followed by the United States, Philippines, and Cuba. The largest consumers of scotch whiskey, gin, and tequila are France, Philippines, and the United States respectively.


Child Labor Index 2012

2011_A4_Map_Template_V03Child labor is a serious problem that affects children all around the world. The International Labor Organization (ILO) defines child labor as “work that deprives children of their childhood, their potential and their dignity, and that is harmful to physical and mental development.” According to ILO, an approximate 215 million children around the world are working. Out of this number, 115 million are thought to be doing dangerous work in hazardous conditions. An estimated 150 million children between ages 5 and 14 are subjected to child labor globally.

According to the Child Labor Index for 2012 published by risk analysis company Maplecroft, countries with the highest risk of child labor violations include Myanmar, North Korea, Somalia, Sudan, Afghanistan, Pakistan, Russia, India, and China among a group of 76 countries.

Read full report at: Maplecroft: Conflict and economic downturn cause global increase in reported child labour violations – 40% of countries now rated ‘extreme risk’


Hunger Map 2012

mdg hunger map 2012One of the targets of the Millennium Development Goals (MDG) is to reduce the number of people with hunger by half by the year 2015. An estimated 870 million people still suffer from hunger around the world.

This map published by the Food and Agriculture Organization of the United Nations (FAO), shows that a good number of developing nations have made progress toward reaching that goal, as can be seen for the countries in green, with East Asia and Latin America as the top performers. On the other hand, many countries in Africa and West Asia have not made any progress, or worse, their situation has even deteriorated as can be seen for the countries in yellow or red.