
Age structure: 0-14 years: 24.11% (male 10,472,844/female 10,000,028)
15-24 years: 13.36% (male 5,806,034/female 5,537,561)
25-54 years: 48.94% (male 21,235,038/female 20,327,384)
55-64 years: 7.72% (male 3,220,074/female 3,337,420)
65 years and over: 5.87% (male 2,316,677/female 2,670,254) (2020 est.)
Definition: This entry provides the distribution of the population according to age. Information is included by sex and age group as follows: 0-14 years (children), 15-24 years (early working age), 25-54 years (prime working age), 55-64 years (mature working age), 65 years and over (elderly). The age structure of a population affects a nation's key socioeconomic issues. Countries with young populations (high percentage under age 15) need to invest more in schools, while countries with older populations (high percentage ages 65 and over) need to invest more in the health sector. The age structure can also be used to help predict potential political issues. For example, the rapid growth of a young adult population unable to find employment can lead to unrest.
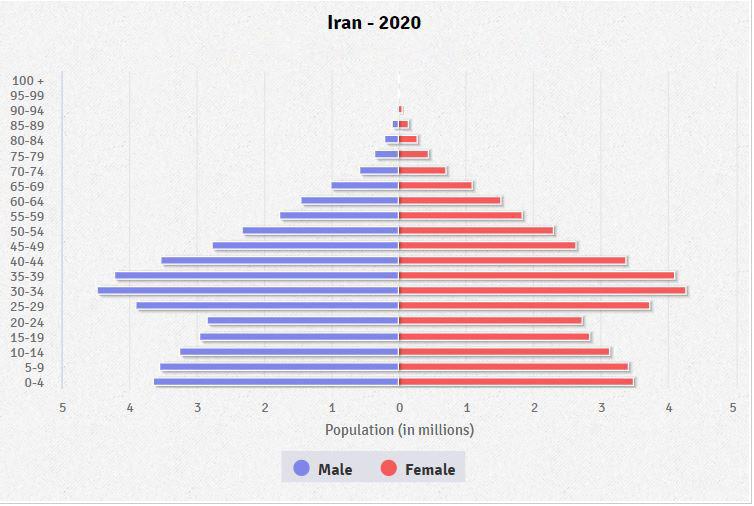
Population Pyramid
A population pyramid illustrates the age and sex structure of a country's population and may provide insights about political and social stability, as well as economic development. The population is distributed along the horizontal axis, with males shown on the left and females on the right. The male and female populations are broken down into 5-year age groups represented as horizontal bars along the vertical axis, with the youngest age groups at the bottom and the oldest at the top. The shape of the population pyramid gradually evolves over time based on fertility, mortality, and international migration trends.
Source: CIA World Factbook - This page was last updated on Saturday, September 18, 2021